MODEL ANSWER:
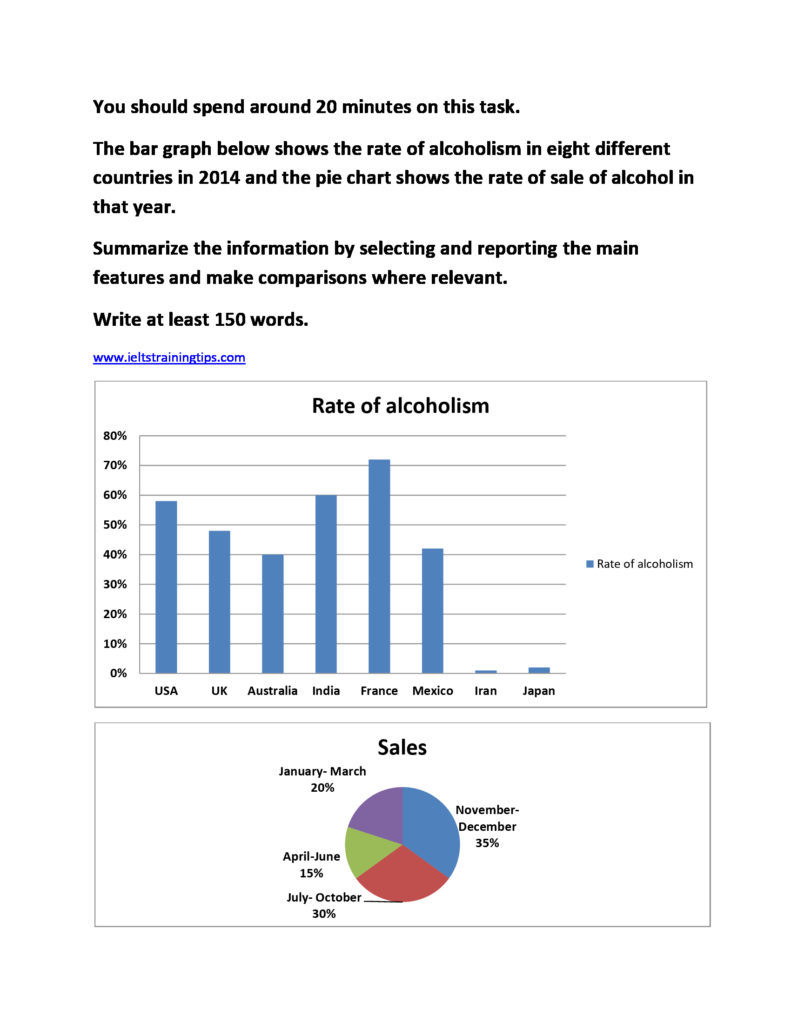
A statistical survey on the rate of alcohol addicts and the pattern of alcohol sales in eight different countries in 2014 is made in the given charts.
As seen in the bar chart, of these countries, alcohol consumption was the maximum (just over 70%) among the French in the given year. The Americans and the Indians were not far behind the scene, and their rate of alcoholism ranged from nearly 58 to 60 respectively. The next notable consumption rate is seen in the UK, Mexico and Australia, which was between 40 to approximately 50. Nevertheless, the rate was nominal in the other two countries, in which the Persians marked the least (Just around 1%).
As per the pie chart, the maximum sales of alcohol in 2014 were recorded in between November and December, which was over a third of the total sales. This was 5% less than the sales between July and October and was as same as the sales rate from January to June.
Overall, when a higher proportion of the French consumed alcohol than the other countries over the year, the rate of sales was higher in the second half of the year.
Word count: 186