MODEL ANSWER:
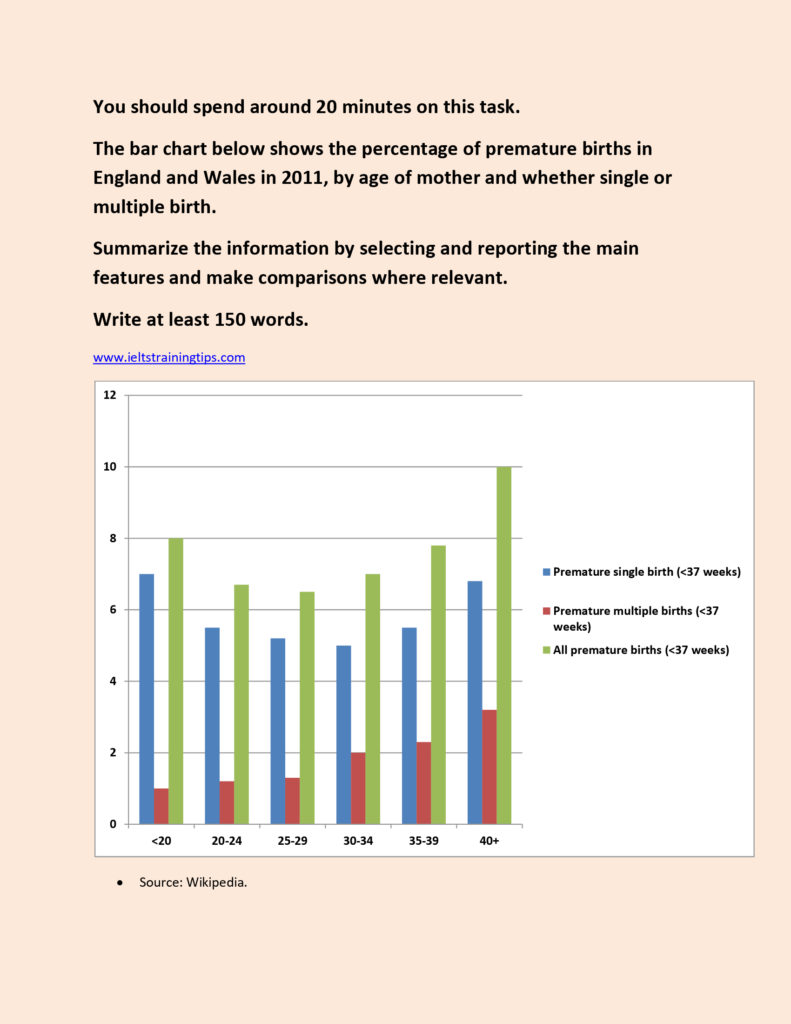
The proportion of premature births by mother’s age and the frequency of births in England and Wales in 2011 are depicted in the given bar chart.
As per the chart, the rate of single births before 37 weeks of pregnancy is seen higher than the rate of multiple premature births in all the age groups. The highest incidents of the former type of births was reported among the youngest (<20) and the latter type was among the oldest (>40) age groups. When the rate of premature single births was nearly 7 among the youngest, it was 0.5 less among the oldest. On the other hand, the percentage of multiple premature births is seen growing higher as the age advanced and this ranged from 0.5 to 2.5. The ratio of both types of premature births is seen subsided among mothers between the age groups 20 and 35 and this ranged from 6.2 to 6.5. The risk was seen greater among the older age groups.
Overall, it can be seen that the rate of the former type of birth varied as the age varied, but the latter’s rate advanced as the age advanced.
Word count:179