CAMBRIDGE 17 ACADEMIC TEST 2 SOLVED


CAMBRIDGE 17 ACADEMIC TEST 2 SOLVED
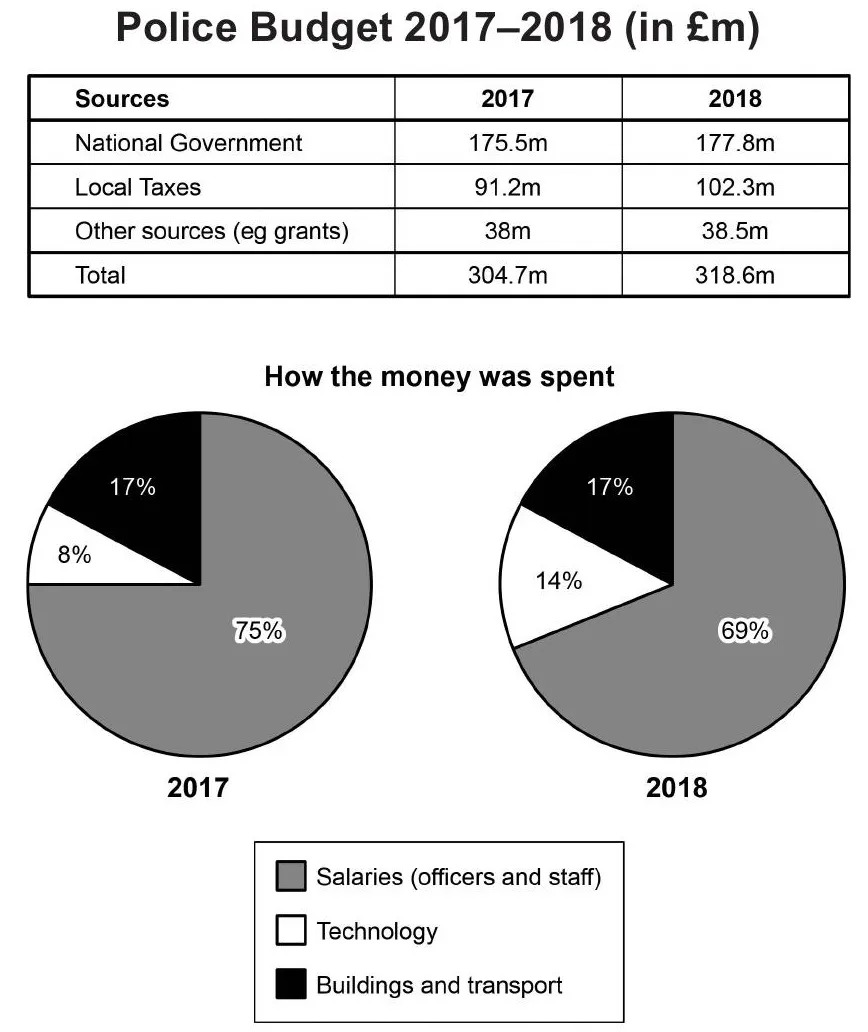
A general layout of the police budget in one area in Britain in 2018 when compared to the year 2017 is portrayed in the given charts.
Overall, it can be seen that there was an increase in the insource of money between the years, whereas most expenditure was dedicated for disbursing salary to officers and staff.
As per the table, out of the total £304.7 million income source, national government was the biggest contributor towards the police budget in 2017. It accounted for £175.5 million, which was £84.3 million more than the next contributing source, that was local taxes. By 2018, this amount of money received from the first source increased by £2.3 million, whereas the income from the second major source hiked by £11.1 million. Around £38 million were generated to the police budget from other sources.
Turning to the pie charts, the highest rate of expenditure was on dispersing salary. This accounted for three-fourth of the total in 2017, which slipped by 6% in the next year. The second most area of spending was on buildings and transport, which stood at 17% in both years. However, a hike is seen in the rate of spending in technology, the least expended area out of the total, and this was from 8% to 14%.
Word count: 199