MODEL ANSWER:
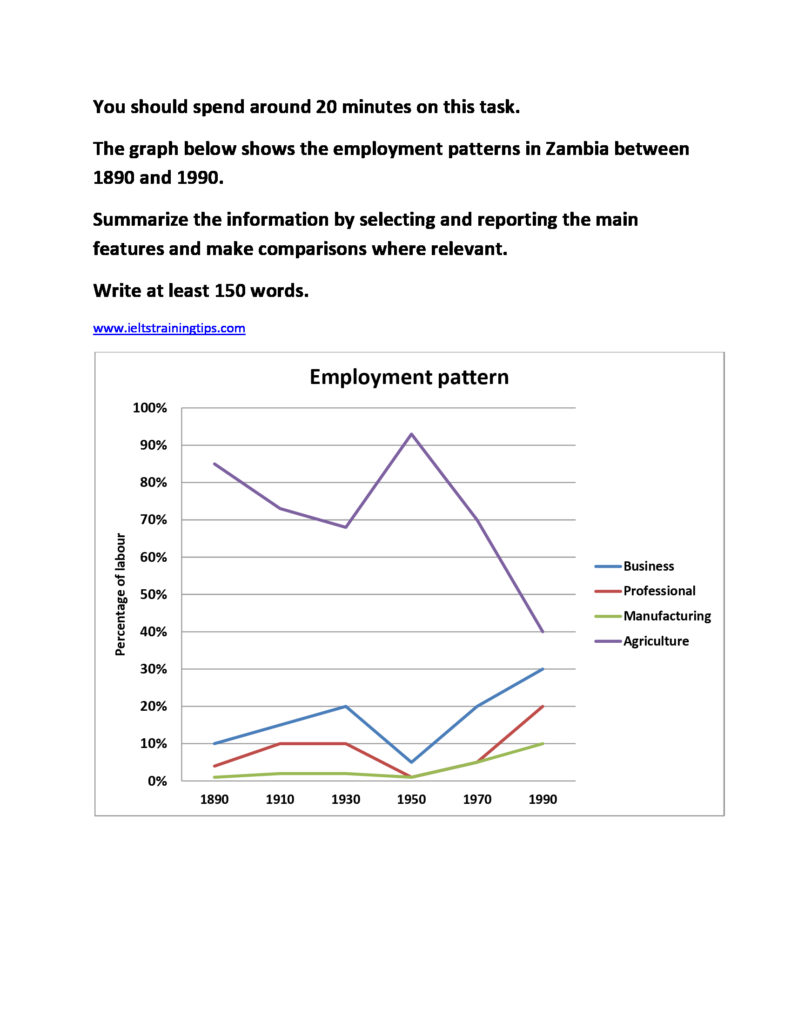
The rate of employment distributed in four different sectors in Zambia over a hundred years from 1890 is depicted in the given line graph.
As per the graph, the country looks much similar to an agrarian one in most of the given period. In 1890, over 80% of the employees in Zambia were either farmers or their supporting subjects, whereas the employment engagement in all the other given areas accounted for a mere 10 to 15%. However, in the next 40 years, the preference shifted slightly from agriculture to the other areas, especially to commerce. When the agricultural sector lost around 15% of its employees, both business and professional sectors gained 5 to 10% of them during this period. Then, till 1950, the trend reversed, with around 90% of Zambians engaging in agrarian activities, shrinking their involvement to nearly 5% in the other sectors. Zambia, however, saw a sharp decline in the rate of employment in agriculture in the final 40 years, when it nose-dived to 40% by 1990. By contrast, this rate inclined to 30, 20 and 10% in business, professional and manufacturing sectors by the end of the period.
Overall, it is clear that, from agriculture, the Zambians were changing their employment preferences to other economic sectors over the given period.
Word count: 195