


You should spend about 20 minutes on this task.
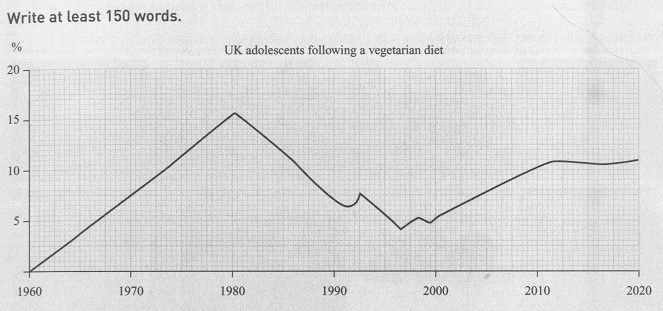
The graph shows the percentage of UK adolescents following a vegetarian diet.Summarize the information by selecting and reporting the main features and make comparisons where relevant.
MODEL ANSWER:
Fluctuations in the rate of adolescents in the UK who followed a vegetarian diet from 1960 till present and its projection till 2020 is given in the line graph.
It is clear from the graph, in 1960, the rate of vegetarian adolescents in the UK was negligible. The following couple of decades showed a steady increase in this rate, which is evident by the zenith mark of 16 by 1980. However, the rate fell back in the succeeding decade, which went below 7.5 in 1990. The last decade of that century showed some frequent irregularities in this rate. However, the share of vegetarians among the UK adolescents rose steadily to over 10% by 2010, and is seen leveling off thereafter till now. The projection (till 2020) is a mere increase in this percentage.
Overall, though there were instances of steady increasing trend in the rate of vegetarian adolescents in the UK in both the centuries, one can generally say this was fluctuating over the period and it is expected to be the same.
Word count: 163