


MODEL ANSWER:
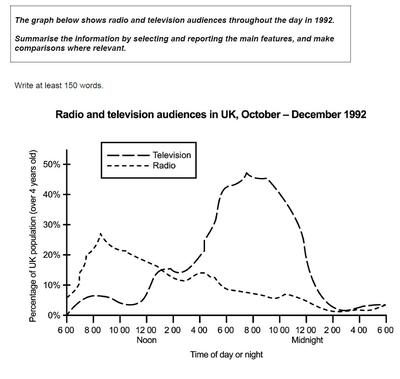
A comparison between the TV viewing population and the radio audiences (over 4 years) in the UK during the last three months of 1992 is drawn in the given line graph.
In general, the share of TV viewers is higher than the on air entertainers and this trend was evident in the afternoons, exceptional in the evenings and this dominance used to remain till a couple of hours after midnight. The TV viewing population of 15% at 2pm used to surge by three fold by 8 pm and then there was a dwindle till it reached around 3% by 3 am. In a couple of hours, it is seen submerged under the rate of broadcast listeners(nearly nil) and then after noon, it is seen increasing its popularity.
The percentage of people who listened to the radio was the highest at 8:30 am (nearly 30%). After 9.00 am, it used to slip steadily despite some fluctuations.
Overall, it is clear from the graph that most of the UK residents preferred watching TV to radio over this period.
Word count:167