


MODEL ANSWER:
Information on the sectoral distribution of water worldwide and a comparison on the water consumption in two countries are illustrated in the twin charts.
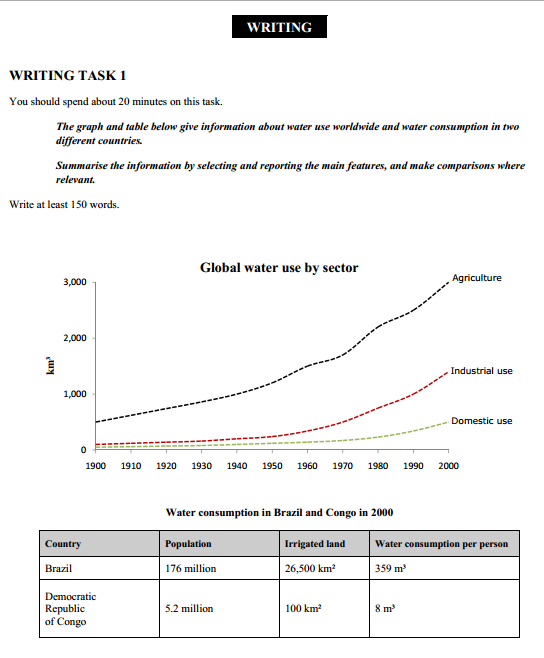
As is shown in the line graph,the global water consumption showed an upward trend from the year 1900 to 2000.It was the highest in the agrarian sector.The quantity of water used in this sector was below 1000 km3 till 1940.Thereafter,it saw a dramatic increase and by 2000 it trebled.The global water consumption in both the industrial and domestic sectors was far below this, however, these too swelled in the second half of the period.
Turning to the table, with 176 million inhabitants, Brazil got 26503 km2 land irrigated in 2000, whereas Congo,which had a population of only 5.2 million got 100 km2 of its land irrigated in the same year.The water consumption per person in these two countries in the same year was 359 m3 and 8 m3 respectively.
Overall,it is understood that the water consumption across the world increased over the given period.It is also noted that in Brazil it was far higher than Congo.
Word count:170