


You should spend about 20 minutes on this task.
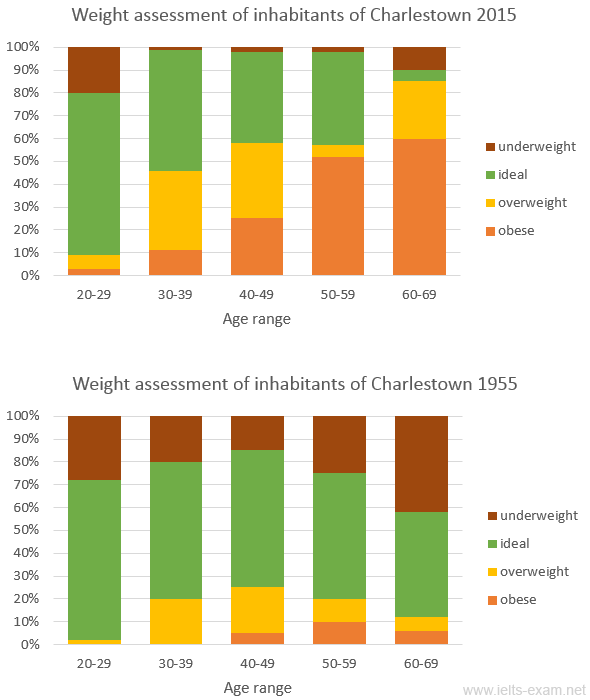
The charts summarize the weight measurements of people living in Charles-town in 1955 and 2015.
Summarize the information by selecting and reporting the main features, and make comparisons where relevant.
Write at least 150 words.
MODEL ANSWER:
A comparison of weight of the natives of Charles-town in 2015 to the year 1955 is shown in the given bar charts.
At a glance, in both the years, the proportion of inhabitants who were in the ideal weight range is seen declining as the age advanced. In 1955, this range was between 70% and 45%, whereas,after 60 years, the range became wider(70-5 %). Obesity was not present between the age group 20 and 39 in 1955, whereas,this was between 4 and 11% in 2015. Compared to the former year, the rate of obesity had a considerable surge in the latter year (almost five – fold )between 40 and 69 age group. When the percentage of overweight people in the Charles-town fluctuated between 3 and 20 among the age groups in 1955, it became more wide (6 to 35) in 2015. A fluctuation is also seen in the number of Charles-town natives between the years and the disparity was less in the latter year(2 to 20%).
Overall ,it is clear that the health status of the people in Charles-town was declining between the years.
Word count:161