


MODEL ANSWER:
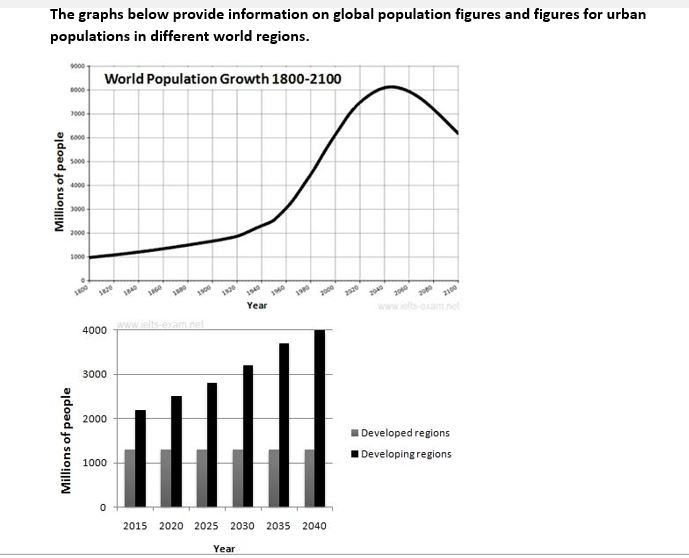
The growth of the world population from 1800 till now and its projection till 2100 are picturized in the first line graph while the second table gives information on urban population from 2015 till now and its projection till 2040.
As shown in the first chart,there was a gradual incline in the world population from 1800 to 1960 and this was from 1 billion to 3 billion. A sharp increase is seen thereafter when it crossed 7 billion mark by 2010 and now it has reached 7.5 billion. The trend is expected to continue for another 20 to 22 years and then is likely to fall to around 6 billion by 2100.
Turning to the second chart, a steady incline can be seen in case of the urban population in developing regions.From over 2.2 billion in 2015, it is expected to reach 4 billion by 2040, whereas the urban population in developing region is anticipated to remain constant at around 1.3 billion.
Overall it is clear that, the world population is expected to have dip in future and at the same time the population of city dwellers in developing regions is expected to rise.