


You should spend around 20 minutes on this task.
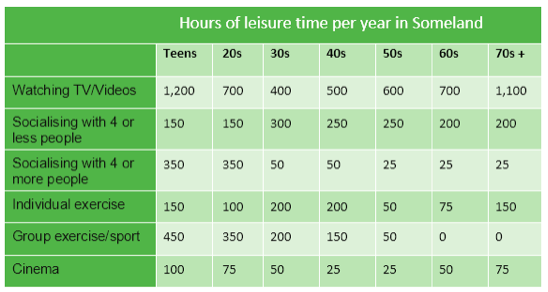
The table below shows data regarding the time spent by the people of Someland per year on various leisure activities divided by age groups. Summarize the information by selecting and reporting the main features and make comparisons where relevant.
Write at least 150 words.
MODEL ANSWER:
Information regarding the duration of leisure time spent by the natives of Someland based on their age is depicted in the given table.
As per the table, watching TV or videos is the most popular leisure time activity for all the ages. This duration ranges from 400-1200 hours per year and both the youngest and the oldest age groups show great interest in it. The time spent at Cinema and socializing with four or less people is similar for almost all age groups. This ranges from 25 to 100 hours for the former category and 150-300 for the latter. However, the number of hours spent on group exercises or sports and socializing with four or more people is inversely proportional as age advances. In case of teens, these figures are 450 and 350 respectively, whereas in case of the 70 plus age group these are zero and 25. An irregular fluctuation is noticed in case of the duration of time spent on individual exercise and this ranges between 50 and 200 hours per year.
Overall, it is clear that, the average time spent on visual entertainment is far higher than the time spent on either exercise or socializing.
Word count: 188