


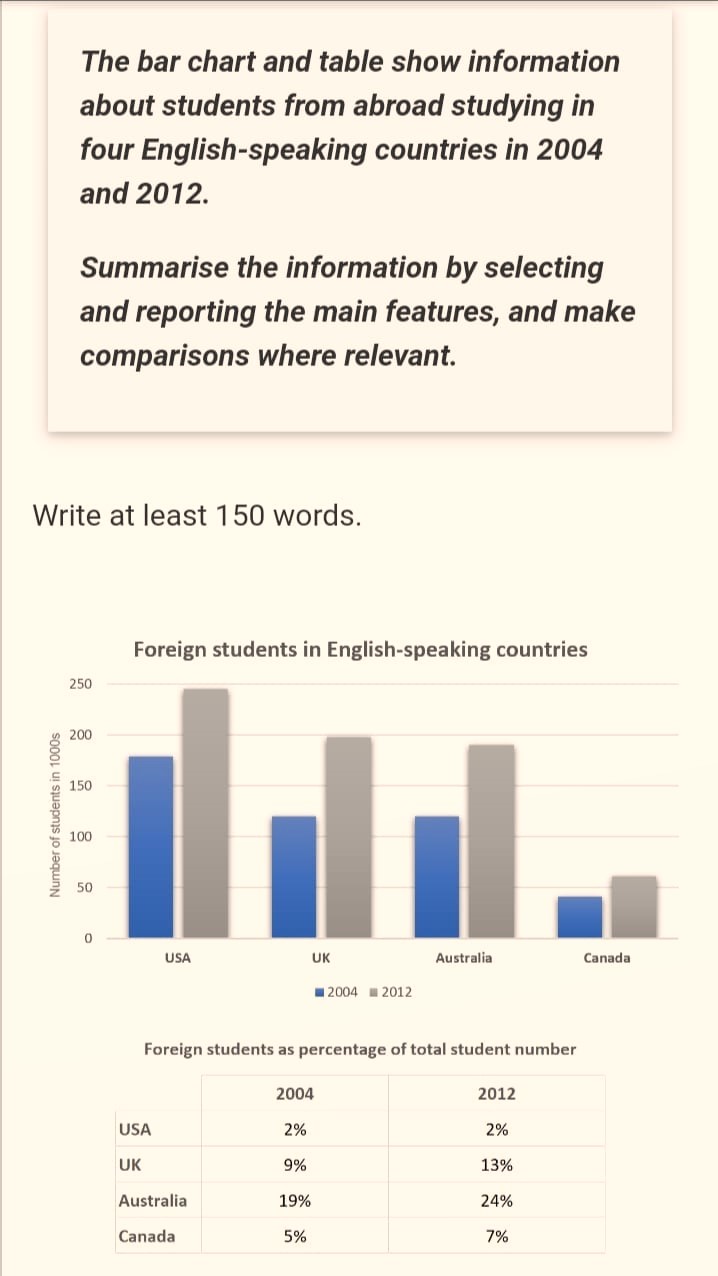
Information on the number of foreign students to four English-speaking countries and the share of these students in the total number of students of these countries in 2004 and in 2012 is represented in the given charts.
Overall, the number of students to these four countries showed an increase between the years. The same trend was there in their representation in the total students’ proportion, except in the USA.
As per the bar chart, the USA accepted higher number of students in both the years. In 2004, the number of foreign students who studied in the USA accounted for around 175,000, which was 2% of their total student intake. By 2012, the number grew to nearly 250,000, but the share of foreign students in the total student proportion remained just 2%.
The number of overseas student intake to the UK and Australia was almost the same. From around 123,000, the number went up to nearly 200,000 in 2012. However, Australia had 19% foreign students’ representation in 2004, while the UK had only 9%. Both countries grew this rate from 4 to 5% by 2012. The least foreign student representation was in Canada in both years (around 50,000), but there too a slight growth was there in the share of overseas students (from 5 to 7%).
Word count: 195