You should spend about 20 minutes on this task.
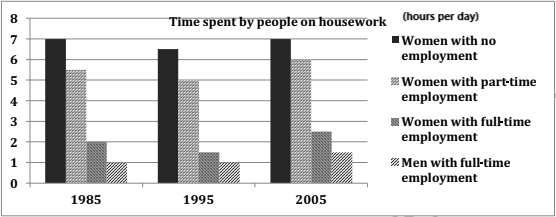
The bar chart below shows the average duration of housework women did (unemployed, part-time employed and full-time employed) when compared to men who did the same who had full-time work in the UK between 1985 and 2005.
Summarise the information by selecting and reporting the main features and make comparisons where relevant.
Write at least 150 words.
The duration of housework done by both men and women in the UK in 2005 compared to two past time frames: 1985 and 1995 is depicted in the given bar diagram.
In general, a similar pattern is seen in this duration in all three years, in which those who are employed (part-time or full-time) spent less time in doing household chores than the unemployed.
As per the chart, women who had no employment engaged in the housework for the longest duration in all the three years. The average duration of their work per day was 7 hours, but in 1995, they spent half an hour lesser. The second longest domestic work duration was recorded among the women who had part-time employment. In 2005, this was 6 hours, an hour more than in 1995 and half an hour more than in 1985.
It is to be noted that full-time employees from both genders spent only a negligible proportion of time in carrying out household activities when compared to the other two groups. The maximum hours which a full-time female employee worked a day was two and half hours, one hour more than the maximum duration a full-time male employee worked, and this was recorded in 2005.
Word count: 195