You should spend about 20 minutes on this task.
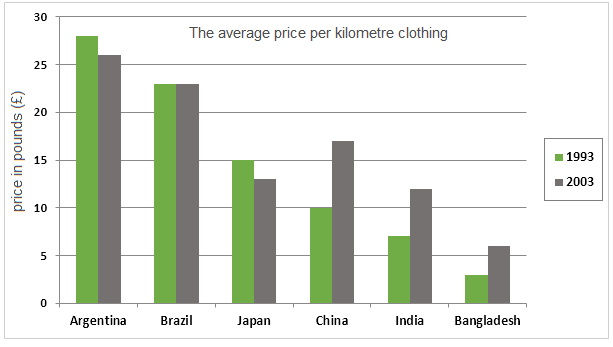
The bar chart below shows the average price per kilometre of clothing imported into the European Union from six different countries in 1993 and in 2003.
Summarize the information by selecting and reporting the main features and make comparisons where relevant.
Write at least 150 words.
The changes which happened in the demand of clothing imported into the European Union from six different countries between 1993 and 2003 are depicted in the given bar chart.
Overall, it is clear that despite being the most favourite in both years, Argentina lost some demand in its exports in the same way as Japan lost, while China, India and Bangladesh making market gains over the period.
As per the charts, the top two positions in the market were adorned by Argentina and Brazil in both the years. When the average cost of one kilometre clothing from Argentina was over £27, it was nearly £23 from Brazil in 1993. Japan, which stood at number three in 1993 earning £15 for a kilometre of its clothing, experienced a setback of £2 in 2003. While the same rate of decline in demand occurred for Argentina, Brazil could stay in the market without any significant loss.
The price of each kilometre of clothes from China, India and Bangladesh rose during the decade, with China making the most significant gain. When China could grow the cloth price it exported by £7 from $10 in 1993, India could increase it only by £5 from $7. Bangladesh remained at the bottom in both years, crossing just £5 in 2003.