MODEL ANSWER:
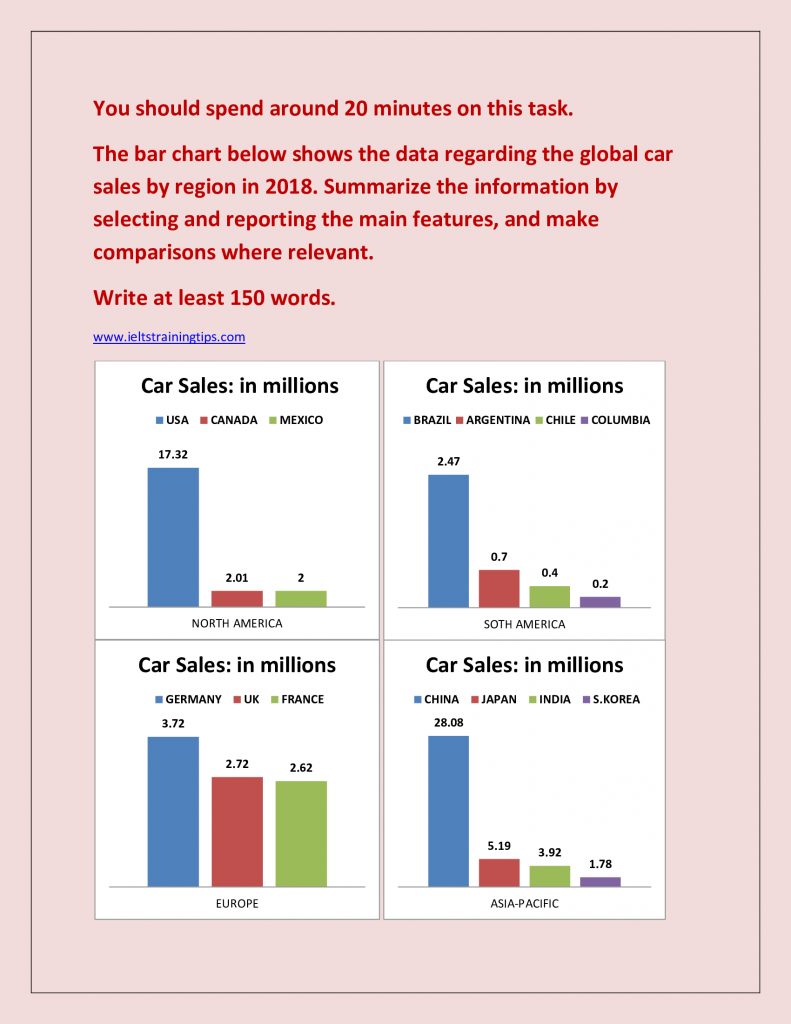
Differences in the regional sales of cars across the world in 2018 are depicted in the given bar charts.
As shown in the charts, the highest sale is seen in Asia-Pacific, in which China stood at the top, selling 28.08 million cars. The second highest sale was recorded in North America, when the USA sold 17.32 million cars. The aggregate sales of cars in Europe and South America were comparatively lower than these two regions, with 9.06 and 3.77 million respectively.
In Asia-Pacific region, where the highest sales recorded, Japan’s car market stood second behind China, selling 5.19 million cars, closely followed by Indian and Korean market (3.92 and 1.78 million respectively).
In North America, the number of cars sold by Canada and Mexico stood at an average 2 million. In Europe, the Germany is seen as the most favorable market for car sales, selling 3.72 million, followed by the UK and France (2.72 and 2.62 million).
When Brazil sold 2.47 million cars in South America, others (Chile, Argentina and Columbia) had not seen even a million sales.
Overall, it is understood that China and the USA held the top positions in the case of global car sales in the given year.
Word count: 189