


You should spend 20 minutes on this task.
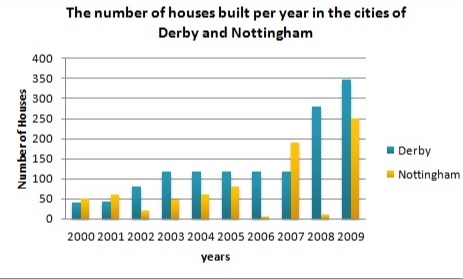
The bar chart below shows the number of houses built per year in two cities, Derby and Nottingham, between 2000 and 2009. Summarize the information by selecting and reporting the main features and make comparisons where relevant.
Write at least 150 words.
MODEL ANSWER>>>
Information on the number of houses constructed in two cities: Derby and Nottingham, between 2000 and 2009 is depicted in the given bar chart.
In general, there was an increase in the number of houses built in the given decade, of which more houses were constructed in Derby than in Nottingham.
As per the chart, in 2000, there were slightly more number of constructed houses in Nottingham than in Derby (50:45). The trend changed in a couple of years, and till 2006, more houses were built in Derby. After a fall in this figure in Nottingham to nearly 20 in 2002 from over 50 in 2001, a gradual revival is seen till 2005, when it touched nearly 75.
A stationary figure of 120 is seen in the number of houses constructed in Derby from 2003 till 2007. However, it increased exponentially in the next couple of years (270 and 350 respectively).
The year 2006 saw the least number of houses built in Nottingham (nearly 2-5), and this was very similar to the year 2008. However, the maximum constructed houses in this city were reported in 2007 and 2009 (180 and 200).
Word count: 170