MODEL ANSWER:
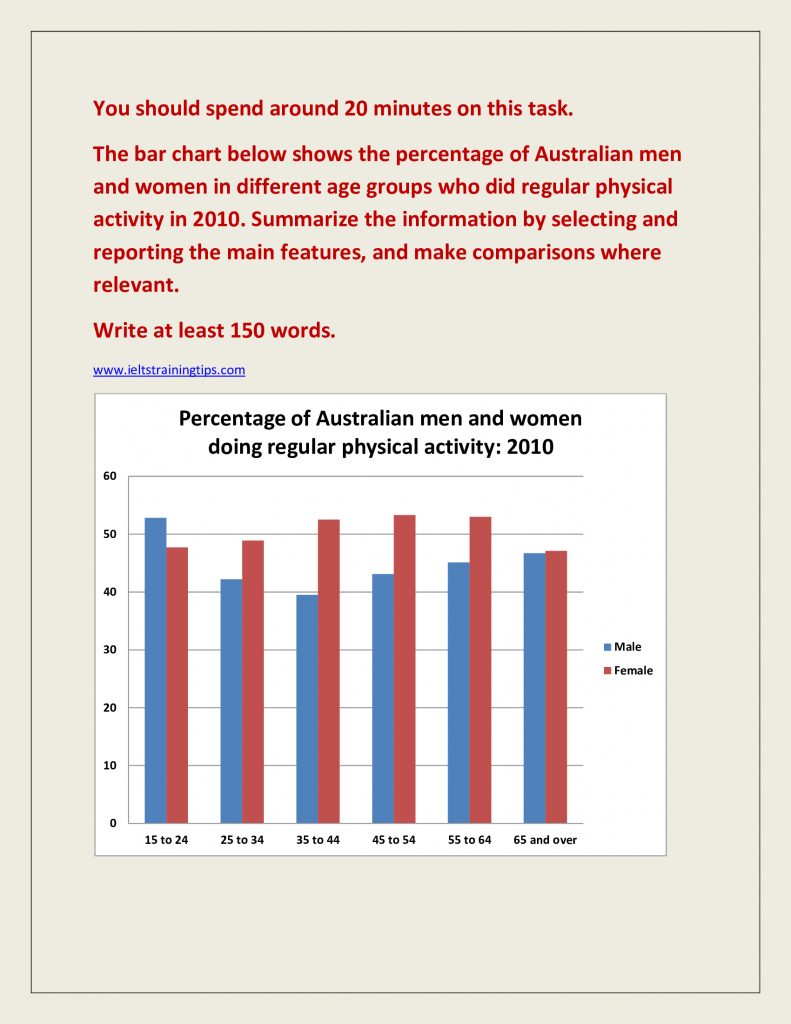
The distribution of Australian citizens in different age groups who were engaged in regular physical activity in 2010 is depicted in the given bar diagram.
Overall, the proportion of Australian women who did regular exercise was higher than their male counterparts, except in case of the youngest age group.
It is clear from the chart that more than half of the Australian women between 35 and 64 were involved in some kind of physical activity, and this was the highest in the 45 to 54 age group (53.3%). Men in these three age groups (35 to 44, 45 to 54 and 55 to 64) were less-interested in performing physical activities, but the rate of those who were involved is seen increased in the older age groups (from 39.5 to 45.1%). However, this proportion is seen almost leveled in case of those who were over 65 (almost 47%). The proportional disparity between the two genders was approximately 6.5% in the age group 25 to 34.
The only exception was reported in case of the youngest age group (15 to 24), in which the male proportion (52.8) stood higher than the females’ (47.7).
Word count:168