MODEL ANSWER:
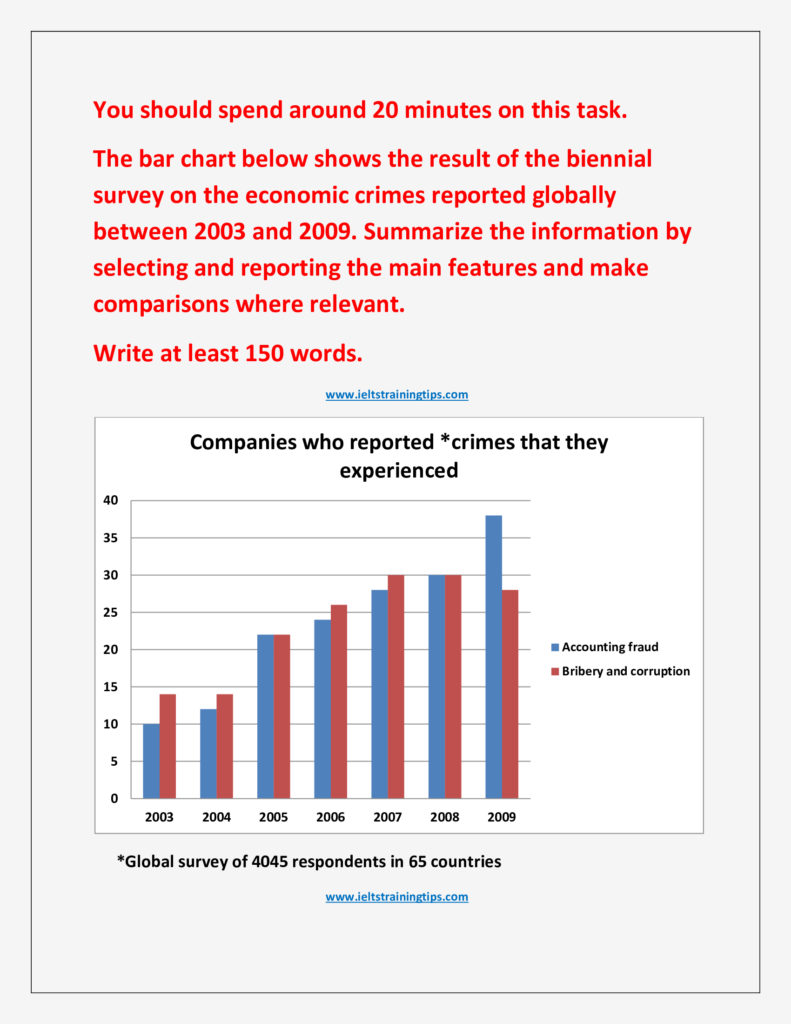
A statistical information regarding the number of companies which reported two types of economic crimes between 2003 and 2009, which was obtained as a part of a biennial global survey is depicted in the given chart.
From an aggregate 4045, the volume of companies which reported bribery and corruption was higher than those which reported accounting fraud. In the first two years (2003 and 2004), the former’s number stood at 14 and the latter’s grew from 10-13. Though this volume grew equal a year later to around 22, the following couple of years saw a higher number of companies reporting bribery and corruption (26 and 30 when compared to 24 and 27). The volume got equalised again in 2008, however, the next year witnessed a steep growth in the number of respondents which reported accounting fraud and this was from 30 to 38. The year was exceptional because it was the only year when the number of companies which reported bribery and corruption less.
Overall, despite some fluctuations, the volume of entities which reported both types of crimes was almost equal during the period.
Word count: 169