


MODEL ANSWER:
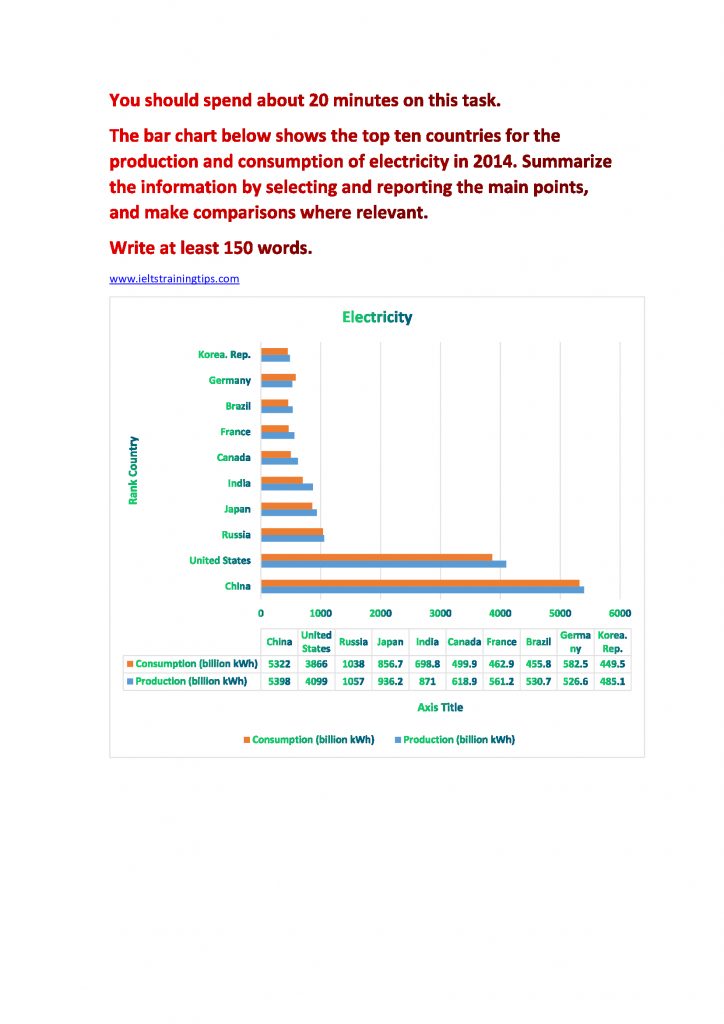
The chart illustrates the production and consumption patterns of power in ten countries in 2014.
Overall, all countries except Germany, had surplus power in the given year.
Of the ten, the top two were China and the USA. The production of power in these two countries were 5,398 and 4,099 billion kWh, which was far ahead than its closest producer, Russia (1,057 billion kWh). The power generation in Canada, India and Japan stood between 618.9 and 936.2 billion kWh, whereas in the rest of the countries (Korea, Germany, Brazil and France), it ranged from 485.1 to 561.2 billion kWh.
Turning to the consumption pattern, the US had 233 billion kWh to spare, which made it the topmost country to save the electricity it produced. India and Canada too had surplus power (173 and 119 billion kWh respectively). When France, Japan, China and Brazil could save between 75 and 99 billion kWh power, Russia and Korea could save only between 19 and 36 billion kWh.
Germany stood as an exception, when it had to find about 56 billion kWh power more than that its production.