


You should spend about 20 minutes on this task.
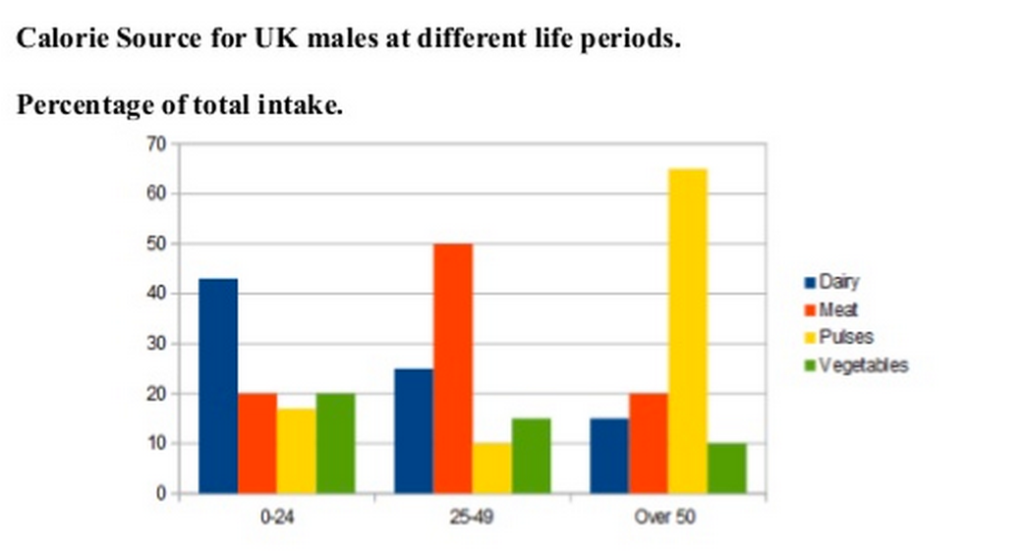
The bar graph below shows information about the calorie source for UK males at different life periods.
Summarize the information by selecting and reporting the main features and make comparisons where relevant.
Write at least 150 words.
MODEL ANSWER:
The calorie share in male population in the UK divided by age groups from four different sources of food is depicted in the given bar diagram.
Overall, it is clear that when the share of calorie in younger age groups is mainly from animal sources, it is different in the older group.
As seen in the chart, the men in the UK under 50 depends mainly on dairy and meat for their calorie intake. When the younger age group (0-24) is more depended on dairy products, the older group (25-49) is seen depended on meat products. Out of the total calories they receive, the former gets around 43% from dairy items whilst the latter gets around 50% from meat. In both age groups the calorie contribution from pulses and vegetables is 20% or less.
On the other hand, the pattern is different in the older age group (over 50). Unlike the younger groups, the main share of their calories here are from pulses (approximately 65%). It is also interesting to note that as the age advances, the calorie contribution from vegetables is seen declining.
Word count:170