


MODEL ANSWER>>>
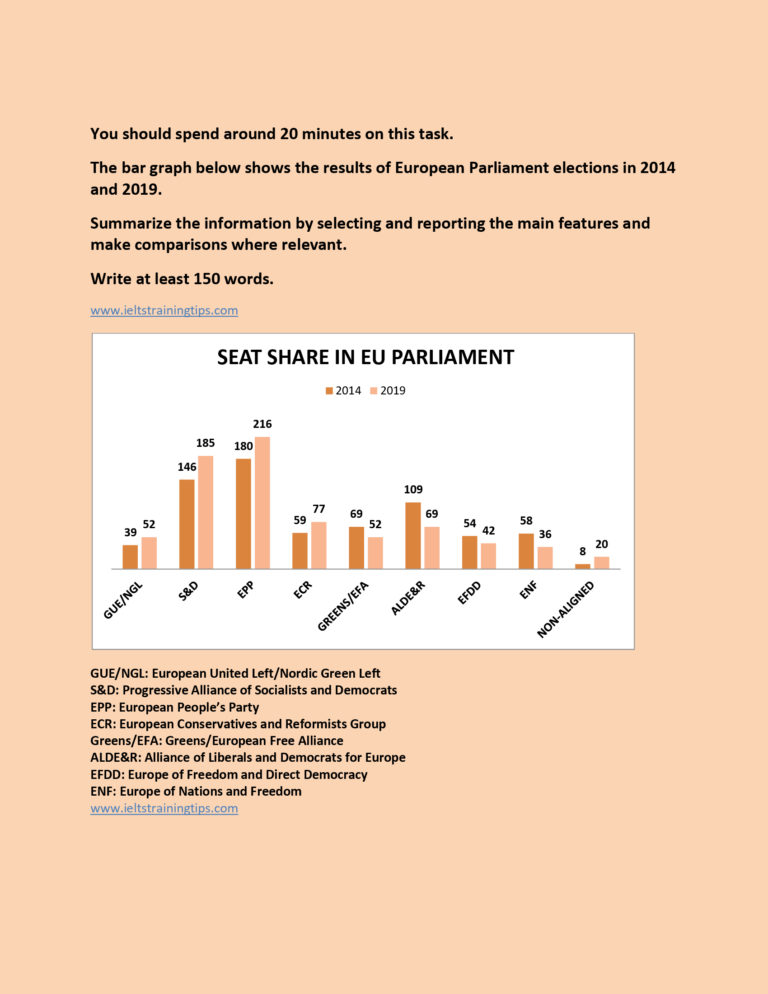
The results of election conducted to the European Parliament in 2014 and in 2019 are compared in the given bar graph.
Overall, it is clear from the chart that except S&D and EPP ,no other political party could make a significant impact in the elections in both the years.
As seen in the chart, when the results got published in 2019 ,out of the major political parties excluding the non-aligned, four made gains. Of the successful, the Progressive Alliance of Socialists and Democrats (S&D) and the European People’s Party(EPP) made their numbers climb by 39 and 36 from their previous standings of 146 and 180 respectively in 2014.The other two parties which added more members to the parliament were GUE/NGL and the ECR (13 and 18 members)
Conversely, ALDE&R lost most seats compared to their previous results. They could satisfy only with 69 members in 2019 ,when compared to 109 in 2014.The other three parties (EFDD, Greens/EFA and ENF)lost approximately 12-22 seats.
It is to be noted that the non-aligned party, could sent 12 more members to the parliament in the latter year.
Word count: 169