


MODEL ANSWER:
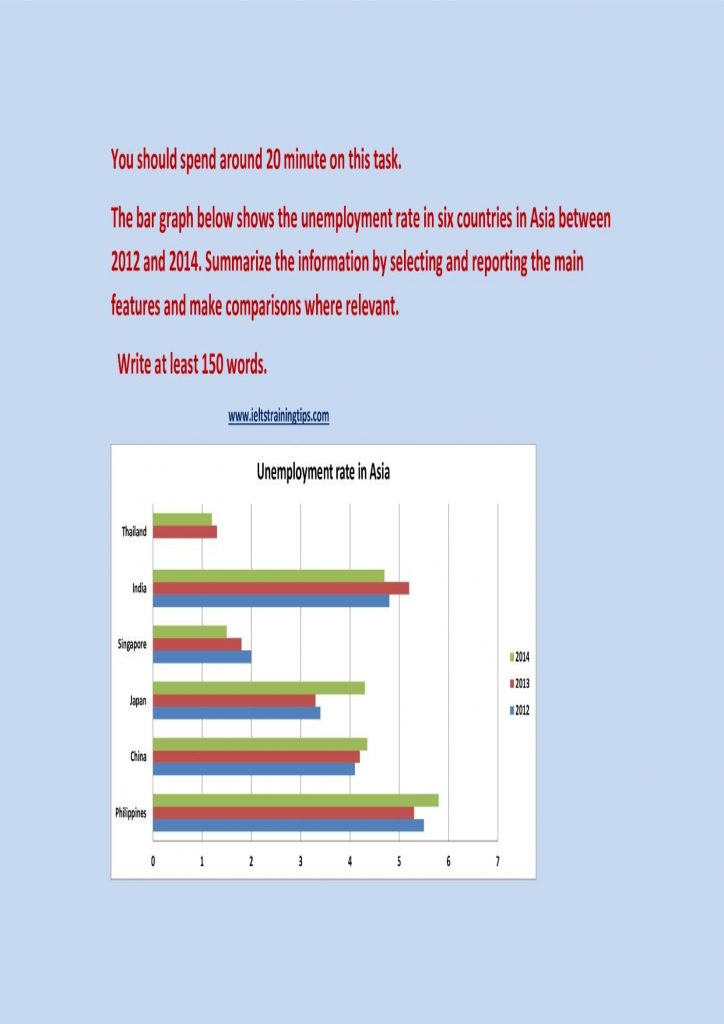
The rate of unemployment in six Asian countries in three consecutive years from 2012 is depicted in the given bar graph.
Overall, it is clear that the rate was generally higher in Philippines and India over the period, whereas the lower rates are seen in Thailand and Singapore.
As per the chart, in 2012, the proportion of unemployed in Philippines was 5.5, which was 0.7 higher than that was in India. The rate was comparatively low in both Japan and China (3.4 and 4.1 respectively). The lowest rate in this year was recorded in Singapore (2%).
In the next year, this proportion rose in both India and China, by almost 0.4 and 0.1, whereas it is seen declining in Philippines and Singapore by 0.2 and 0.3 respectively. Thailand recorded the least unemployment rate in this year, with just 1.25.
The situation became worse in Philippines, China and Japan, when the rate showed a hike in 2014. Philippines became the worst affected when the rate hit an all-time high of about 5.8. The rate of growth of unemployment in Japan was almost 1, which was the highest ever recorded among the six countries. On the other hand, India, Singapore and Thailand had made their condition better, when their rates slipped by 0.5, 0.4 and 0.1 respectively.