


You should spend about 20 minutes on this task.
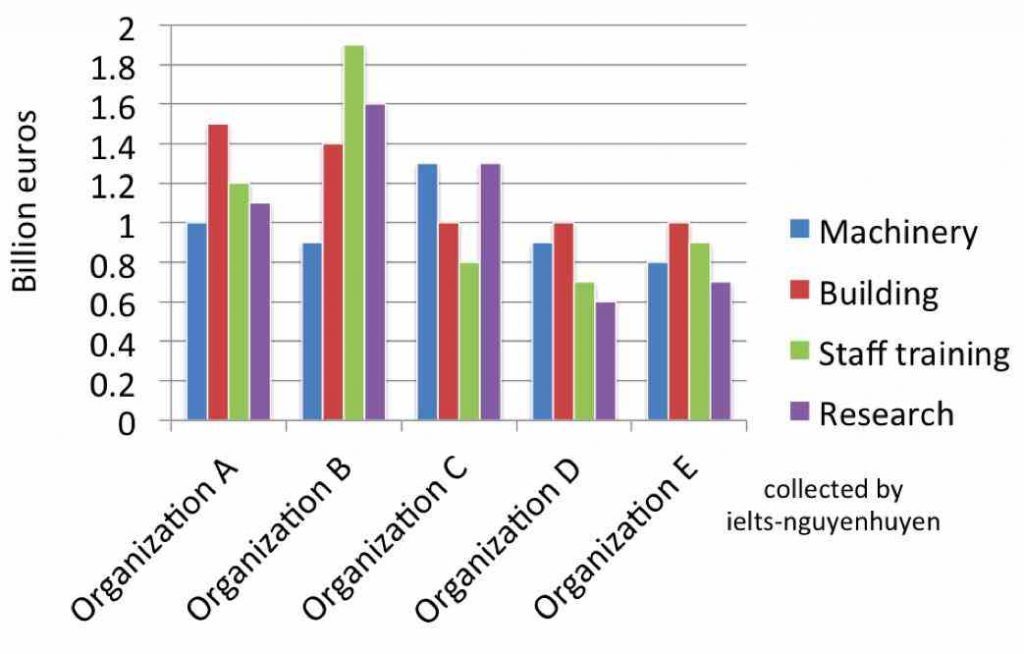
The chart below gives information about billions of euros invested in four areas by various organisations.
Summarize the information by selecting and reporting the main features and make comparisons where relevant.
Write at least 150 words.
MODEL ANSWER>>>
The investment pattern of five organizations on four different sectors is detailed in the given bar graph.
Overall, it is clear that organization B spends the most. Though there were varying trends for all organisations in the investment, building appeared to be near the top for most of them.
As per the chart, in organization B, where the most fund allocation is done, the highest allocation is for training staff, and this is about €1.9 billion, which is almost €0.7 billion more than organization A. The range of spending in other organizations in this area is between €0.7 and €0.9 billion.
The next area in which they (organization B) focus their spending is on research, and this is about €1.6 billion, which is €0.3 billion more than organization C.the fund allocation range of other firms in this sector ranges between €0.6 and €1.1 billion.
Building sector is the next focus of funding by this organization, and the figure is exactly €1.4 billion, which is €0.1 billion less than organization A. All the other firms spend exactly a billion in this area.
The fund allocation on machinery is €0.9 billion in both organization B and D, which is €0.4 and €0.1 billion less than organization C and A respectively. However, compared to organization E, it is €0.1 billion more.