


You should spend about 20 minutes on this task.
The chart below gives information about billions of euros invested in four areas by various organizations. Summarise the information by selecting and reporting the main features, and make comparisons where relevant. Write at least 150 words.
MODEL ANSWER>>>
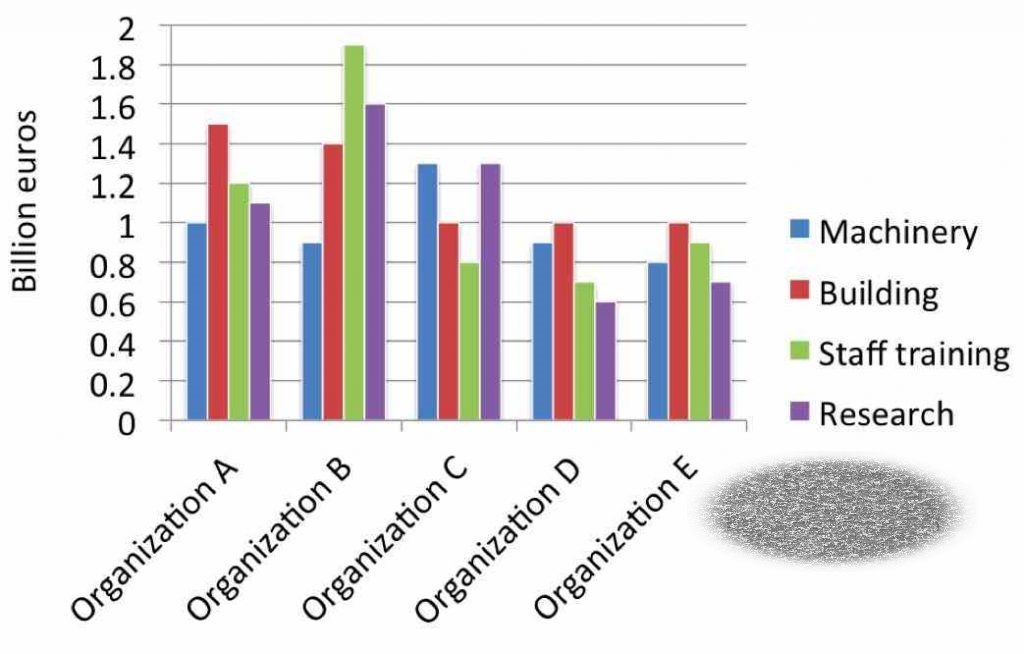
Information on the investment pattern by five different organizations on four individual sectors over a given time period is depicted in the given chart.
Overall, it is clear that on an average, when the highest investment was made in the building sector, the lowest was made in machinery.
As per the chart, the organization B made the highest investment, and this was in staff training. When this was 1.9 billion euros, it spent exactly 1.6 billion on research, which stood the second. A 20 million difference is seen between the funding on research and building sectors, whereas machinery was the area in which it spent the least (0.9 billion).
The aggregate investments of both organizations A and C were almost equal; however, their distribution pattern differed. When the former concentrated more in building with 1.5 billion, the latter gave priority to both machinery and research equally (1.3 billion).Machinery was the least attended area in organization A (1 billion), while, it was staff training in the other firm (0.8 billion).
Both organizations D and E had lesser investments compared to other firms, and both invested the most in building (1 billion) and the least in research (0.6 to 0.7 billion). However, the pattern of investment differed in the other two sectors.