


You should spend about 20 minutes on this task.
The chart below gives information on the percentage of British people giving money to charity by age range for the years 1990 and 2010.Summarize the information by selecting and reporting the main features and make comparisons where relevant.
Write at least 150 words.
MODEL ANSWER>>>
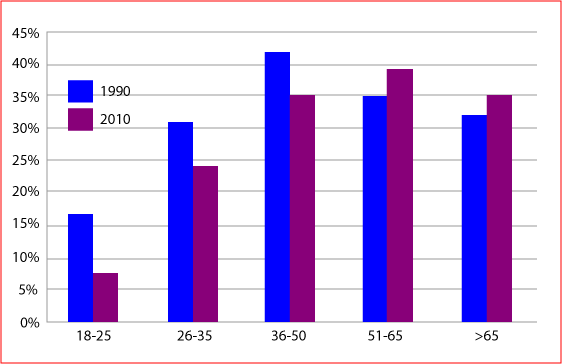
The rate of British citizens who contributed their money to charity divided by age groups between 1990 and 2010 is depicted in the given bar chart.
Overall, it is clear that the proportion of those who donated in this area declined between the years, which is particularly notable among those who are not in the older age groups.
As per the graph, those who were under 50 spent less in charity works in 2010, compared to 1990. The rate of decline in their expending habit was between 6 and 10%, and this is seen the highest among the youngest age group (18-25). When this group disbursed just over 17% in 1990, it declined by about 10% in 20 years of time. The percentage of decline ranged from 6 to 7% in the other two age groups (26-35 and 35-50). It should also be noted that the share of people who contributed to charity is seen ascending among these three age groups.
However, the case was different in case of those who were over 50. Out of about 30-40% ,there was around 3 to 4% hike in the percentage of those who spent money in this sector between the years, and this was seen higher in the age group: 50-65.
Word count: 188