REAL ACADEMIC TASK 1 QUESTION: APPEARED ON 19 MARCH, 2022 (PEN AND PAPER TEST)


REAL ACADEMIC TASK 1 QUESTION: APPEARED ON 19 MARCH, 2022 (PEN AND PAPER TEST)
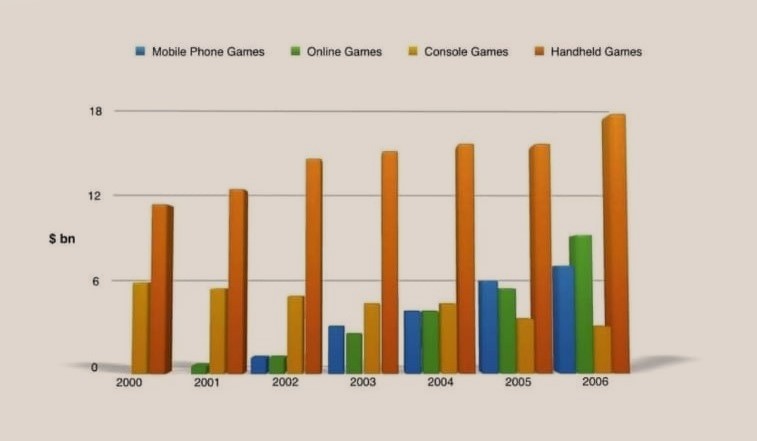
The bar chart represents the sales of four different kinds of games in the international market between 2000 and 2006.
Overall, it is clear that except console games, the popularity of other games in the group was increasing over the period.
As per the chart, the global sales of handheld games stood at the top from the year 2000, till 2006. This was in an ascending pattern from about $10 billion to around $18 billion. However, this growth was somewhat stagnated between 2004 and 2005 at about $15 billion. The next position in sales was held by online games. When its sale was first recorded in 2002, its sale was just around $2 billion. Since then, the sale grew, and in 2006, it hit almost $9 billion. The sale of mobile phone games also showed a similar pattern, and this ranged from $3 billion in 2002 to $7 billion in 2006.
The only exception was the sale of console games. The global market witnessed a drop in its sale, and this was from approximately $6 billion in 2000 to under $3 billion in 2006.