You should spend about 20 minutes on this task.
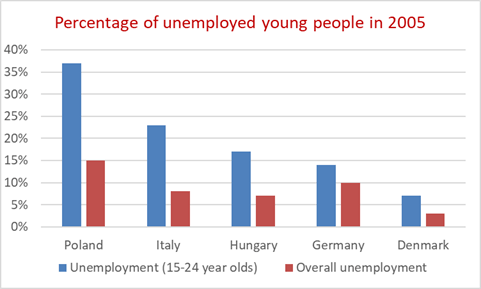
The chart below shows the percentage of unemployed people aged between 15 and 24 in five European countries in 2005, compared with the overall percentage of unemployment in those countries.
Summarise the information by selecting and reporting the main features, and make comparisons where relevant.
Write at least 150 words.
Data regarding the rate of overall unemployment when compared to the unemployment of a specific younger age group in five European countries in 2005 is elucidated in the given bar graph.
Overall, it is clear that the rate is much higher among the younger group when compared to the overall statistics in all countries.
As per the chart, the highest overall unemployment was there in Poland in 2005. Out of its15% of total unemployed, 37% were from the age group 15-24. Germany was the next severely hit country with the crisis, but the effect on the younger age group was less severe when compared to Poland. The proportion of 15-24 age group who suffered unemployment was just under 15, when compared to its overall unemployment rate of 10%.
When the overall percentage of those who suffered unemployment in Italy and Hungary stood between 6 and 8; the shares of unemployed youths there from 15 to 24 years were nearly 24 and 17%, which were higher than that in Germany. The least affected country with the crisis was Denmark. The proportion of young who did not have job there was about 8% when compared to just 3% of its overall unemployment statistics.
Word count: 186