


You should spend about 20 minutes on this task.
The chart illustrates consumption of three kinds of fast food by teenagers in Mauritius from 1985 to 2015. Summarise the information by selecting and reporting the main features, and make comparisons where relevant.
Write at least 150 words.
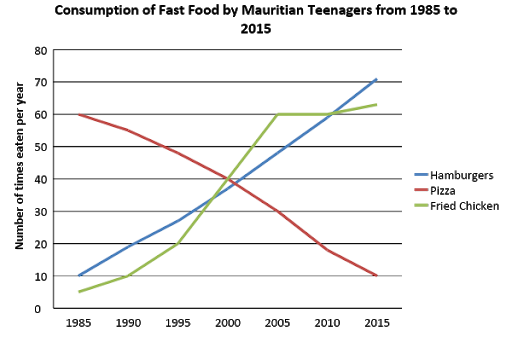
The given line graph illustrates the consumption pattern of three types of fast food by the adolescents in Mauritius between 1985 and 2015.
Overall, it is clear that the pattern of consumption was inversely proportional in case of pizza and hamburgers, with the latter increasing its popularity along with fried chicken.
As per the chart, pizza was the most favorite fast food among the Mauritian teenagers in 1985. On an average, when this was eaten 60 times per person in that year, the frequency of consumption of the other two food varieties (hamburgers and fried chicken) was 10 and 5 respectively.
It is to be noted that when the number of times adolescents in Mauritius ate pizza started declining from 1985, their preference to the other two foods grew, and in 2000, the consumption rate of all three foods was recorded somewhere near 40.
When pizza consumption continued to decline, hamburgers’ preference went up steadily to 70 times per year by 2015. There were more fried chicken eaten than hamburgers and pizza between 2000 and 2005, however, it fell behind the choice for hamburgers between 2010 and 2015 (just over 60 times a year).