


MODEL ANSWER:
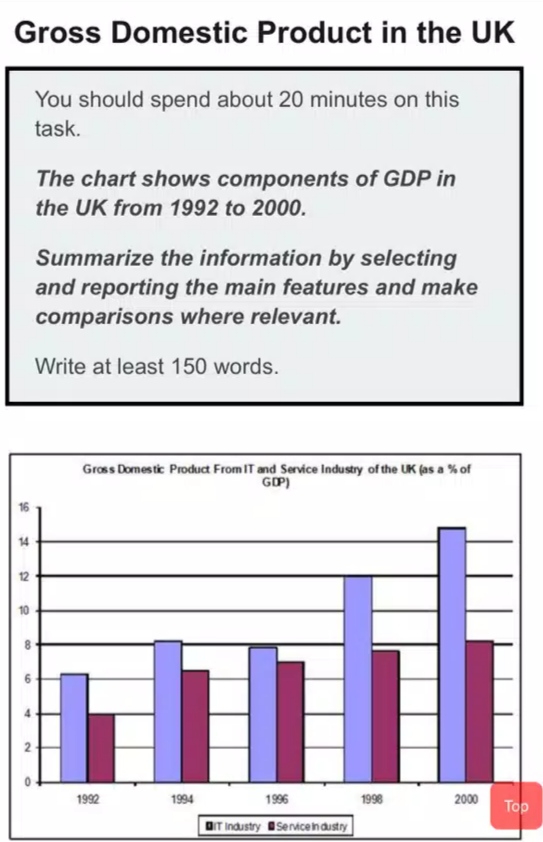
Contributions to the national GDP of the UK from IT and service industries between 1992 and 2000 are compared in the given bar chart.
At a glance , it is understood IT industry had contributed better to the national GDP than the other over the period.
As per the chart, in 1992, the share of the IT industry in the UK’s GDP was just over 6%, whereas the service industry could contribute only 4%. In the next four years (till 1996), both the industries’ contribution grew, with the former performing stronger than in the past (1992). Over these years, the latter’s share to the GDP grew to 7%. At the same time, the IT industry suffered a stagnation, when it contributed an average 8% to the GDP.
The situation is seen different in the next half, with a substantial increase in the IT sector’s share in the national GDP. It attained its maximum growth between 1996 and 1998( from 8% to 12%) and the trend continued till the end of the period (2000), but at a slower pace to reach over 14%.
It is also notable that despite its greatest contribution to the GDP between 1992 and 1994 ( over 2%), the service industry failed to make a significant impact when its share to the GDP is analysed till 2000(8%).