You should spend about 20 minutes on this task.
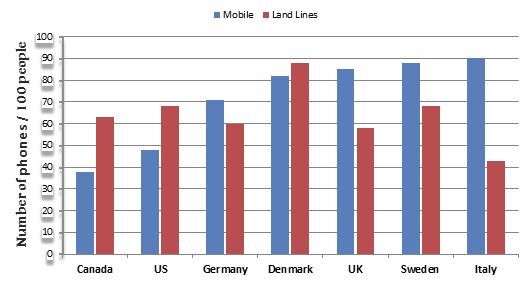
The chart shows the number of mobile phones and landlines per 100 people in selected countries.
Summarise the information by selecting and report in the main features, and make comparisons where relevant.
Write at least 150 words.
The subscriptions to mobile phones when compared to landlines in some countries in North America and Europe are illustrated in the given bar graph.
Overall, it is clear that when the North American countries have more preference to landline connectivity, in Europe, it is the other way round, with Denmark as the only exception.
As per the chart, in case of the connectivity, Denmark stands first. Out of every 100 Danes, only just over a ten miss a landline connection, whereas just almost a-fifth do not have any mobile phone. However, Italy is the country which tops the mobile phone connectivity, followed by Sweden and the UK. In Italy, it is 90 out of every 100 population, while in the other two countries; it is about 88 and 86 respectively.
In case of the rate of landline subscriptions, Americans and Swedes stand next to Danes. When around 70% of the people in both these countries have this type of connection, in the UK and Germany, it is about 10% less. When the least proportion of people who have landline is from Italy (just over 40%), in case of mobile phones, not even 40% Canadians have its access when compared to over 60% who have landline connection.
Word count: 196