


You should spend about 20 minutes on this task.
MODEL ANSWER>>>
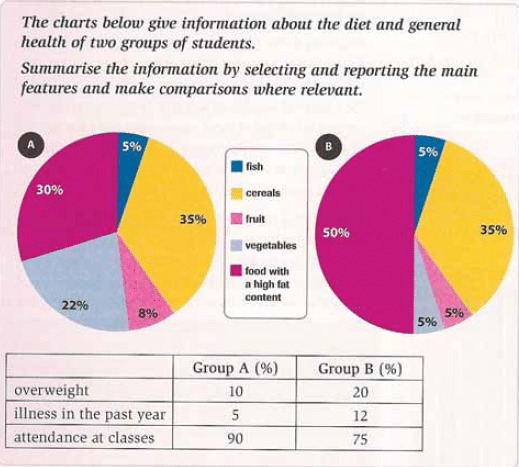
The diet and general health of two student groups: group A and group B are portrayed in the given charts.
Overall, it is clear that more diversity is seen among the students’ diet preferences in group A, and they appear to be healthier.
As per the pie charts, most students in group A have cereals (35%), whereas most in group B prefer to have food with high fat content (50%). Fatty foods are seen less common among group A students (30%). Just over a third in both groups consumes cereals, which is another common trend one can observe other than the least preferred food: fish (5%). Around 30% of students in the first group include vegetables and fruits in their diet, whereas this accounts for just 10% in the second group.
It is clear from the table that absenteeism is less common in from group. When 10% students are seen absent in group A, this accounts for a quarter in group B. Only 10% from the former group are reported to be overweight, which is just half of the other group. About 12% in the latter group suffered illness in the previous year, compared to just 5% in case of the former.
Word count: 192