MODEL ANSWER:
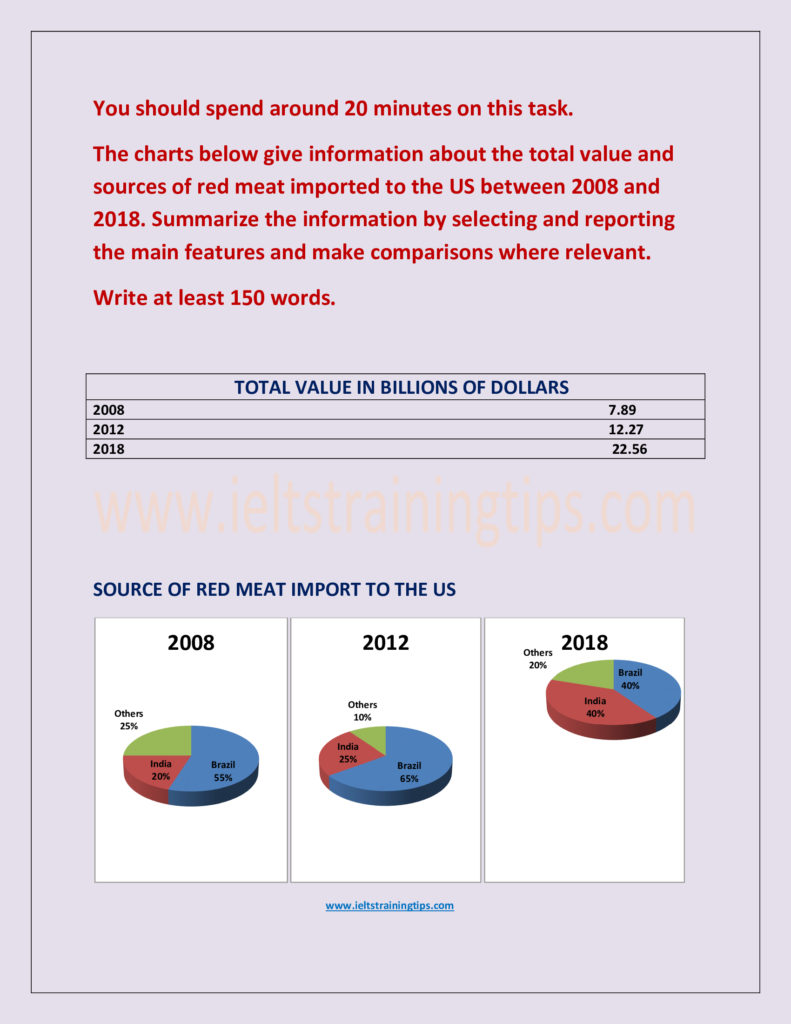
Data regarding the worth and the source of red meat which is imported to the US in three years (2008, 2012 and 2018) is portrayed in the given charts.
Regarding the gross value of the imported meat, which is shown in the table, one can definitely say it hiked in the decade (2008-2018). In 2008, it was just $7.89 billion. After four years, there was a $4.38 billion hike in the value and then it grew further by $10.29 billion in 2018.
The pie charts clearly show Brazil’s dominance in the red meat import to the US during the period. This was particularly true in both 2008 and 2012, where it enjoyed more than half of the total share of the imports (55 and 65% respectively). Over this period, India, another significant exporter of red meat to the US, could expand its share of total imports to the US from one-fifth to one fourth and it could equal this share to Brazil’s (40%) by 2018. The contribution of others was fluctuating all through the years.
Overall, it is clear that there was an increase in the total value of red meat imports to the US and Brazil played a significant role in the share of imports in the aforementioned years.
Word count:195