


MODEL ANSWER>>>
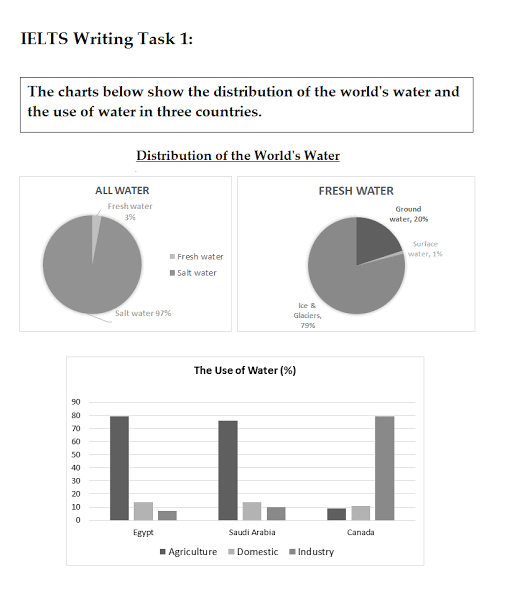
Information regarding the global water distribution and its pattern of consumption in three different countries is portrayed in the given chart.
As per the pie charts, of the total global water availability, the lion’s share (97%) is saline. Of the 3% freshwater left, just 1% is available as surface water, whereas the rest is found as ground water (20%).The remaining fresh water is held in ice and glaciers (79%).
Turning to the rate of water consumption among the first two mentioned countries in the bar graph (Egypt and Saudi Arabia), the agrarian sector consumes most quantity of water. It accounts nearly 80% of the total consumption. The rest is seen distributed almost equal between domestic and industrial sectors with the rate of consumption in the former sector slightly higher. However, in Canada, this pattern is almost the opposite, where the share of water used for industrial purposes is the highest at nearly 80%.
Overall, it is clear that the distribution of world’s water resources and the consumption pattern in the aforementioned countries differ.
Word count: 167