You should spend around 20 minutes on this task.
The charts below show the percentage of water used for different purposes in six areas of the world.
Summarize the information by selecting and reporting the main features, and make comparisons where relevant.
Write at least 150 words
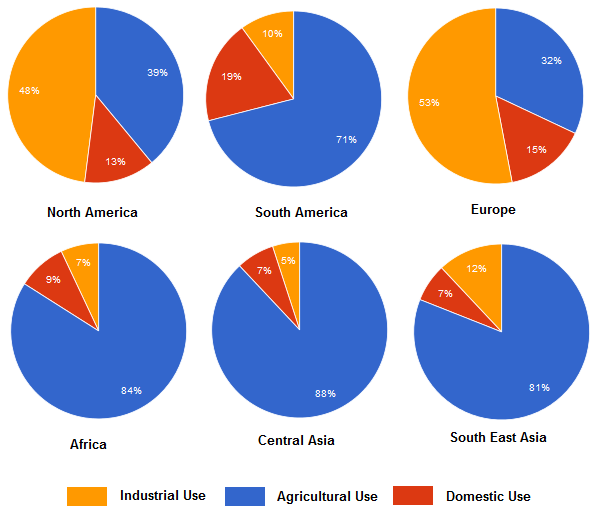
Information on the proportion of water usage in three sectors among six areas of the world is depicted in the given pie charts.
In general, in most countries the lion’s share of water is used for agriculture, whereas in North America and Europe, it is for industries.
As per the charts, out of the total consumption, the percentage of water used for irrigation in areas other than Europe and North America ranges between 71 and 88%. The second major usage of water in these areas was to meet the domestic needs and this range from 7% to 19%. However, South East Asia is an exception in this group, where the water consumption is more in industry (12%) than in houses (7%).
Turning to Europe and North America, the highest demand of water is in the industries. Out of the total usage, the industrial demand of these regions is 53% and 48% respectively. When around 32% and 39% of water is used for agriculture, the average domestic use of water in these areas is 14%.
Word count: 163
FOR VIDEO EXPLANATION:https://youtu.be/KBbfcRkogu0