You should spend about 20 minutes on this task.
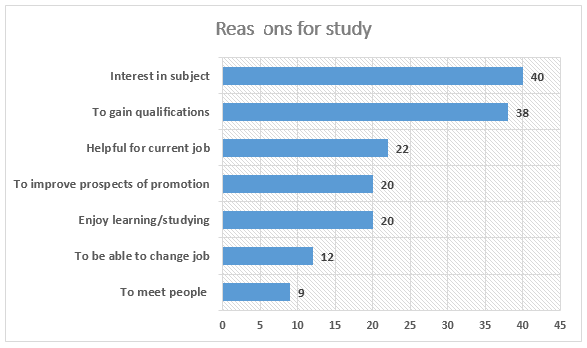
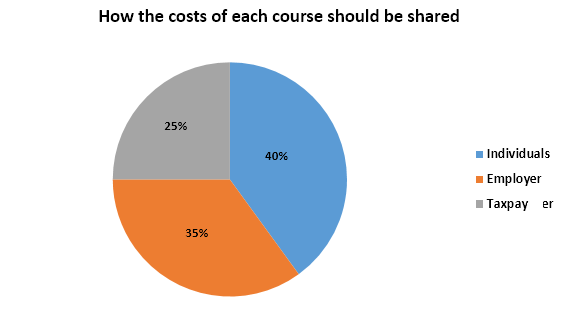
The charts below show the result of a survey of adult education. The first chart shows the reason why adults decide to study. The pie chart shows how people think the costs of adult education should be shared.
Summarise the information by selecting and reporting the main features and make comparisons where relevant.
Write at least 150 words.
A survey report on the motivational factors which persuade adults to study along with the pattern of funding the courses they enrol in is depicted in the twin charts.
In general, while the motives of study differ for different people, the opinion is clear that the cost of the study should be shared among individuals, employers and governments.
It is apparent that career-related motives persuade a considerable proportion of adults to study. For instance, when 22 out of 100 respondents opined it is helpful for current job, 20 enrolled the courses for promotion. Around 12% pursue their studies to change their job.
It is interesting that nearly 40% adults study because they are really interested in the subject. When 38% need to gain qualifications, 20% just enjoy studying. Just 9% reported that their motive is to meet people.
Turning to the way which the cost of this education is divided, the report revealed that two-fifth of the total expense should be borne by individuals themselves. While employers are suggested to spend 35%, governments are recommended to spend the rest.
Word count: 170


