


The given charts compare how 100 guests rated the customer service of the Parkway Hotel on a questionnaire in 2010 as they did in 2005.
At a glance, it is obvious that the hotel’s rating had turned very positive from a below average performance over the period.
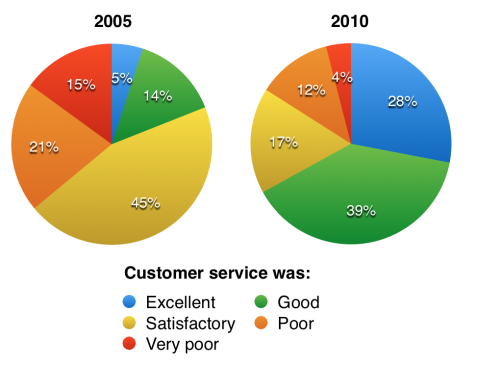
As per the first chart, in 2005, very few had rated the hotel as either ‘good’ or ‘excellent’. From 19 guests who had this opinion, only 5 marked it as ‘excellent’.
On the other hand, nearly half of the respondents were just satisfied with the hotel in 2005. When 45 guests reported this on the questionnaire, 21 marked the hotel as ‘poor’, and 15 ‘very poor’.
It is to be noted that the same respondents had a different general opinion in 2010. When almost two-fifth (39 guests) opined that the service of the hotel is good, 28 of its customers gave it an excellent rating.
The rate of those who marked it ‘satisfactory’ and ‘poor’ reduced to 17 and 12, whereas just 4 customers were still extremely dissatisfied with its service.
Word count: 162