


MODEL ANSWER>>>
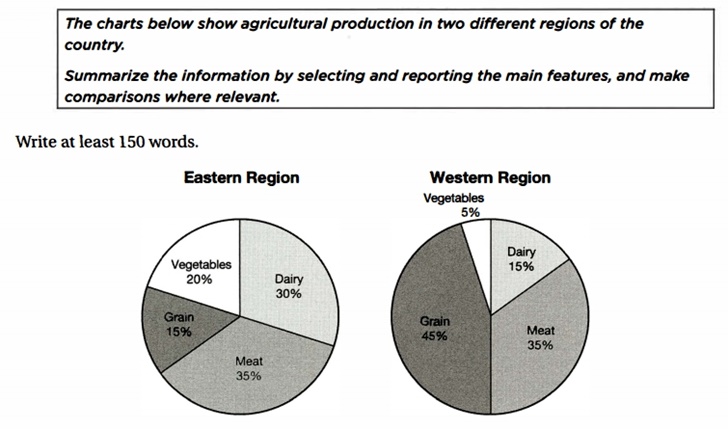
A clear cut comparison of the percentage of agricultural products from both the eastern and western regions of a particular country is portrayed in the given pie charts.
Overall, it is clear that except in the case of meat products, the proportion of production is dissimilar in both regions.
Turning to the share of agro-production in the eastern part of the country, meat stands first, with just over a third of the total (35%). Though the western region too produces the exact proportion of meat, grains occupy the topmost position there, which accounts for nearly half of the total production share (45%).
When dairy products are the second most produces in the east, with 30% of the aggregate, the western region produces only its half.
The gross share of vegetables and grains in the east account for 35%, with 20 and 15% respectively. The least recorded rate of agro-product in both regions is 5; in the case of vegetables and that is in the western region.
Word count: 159