


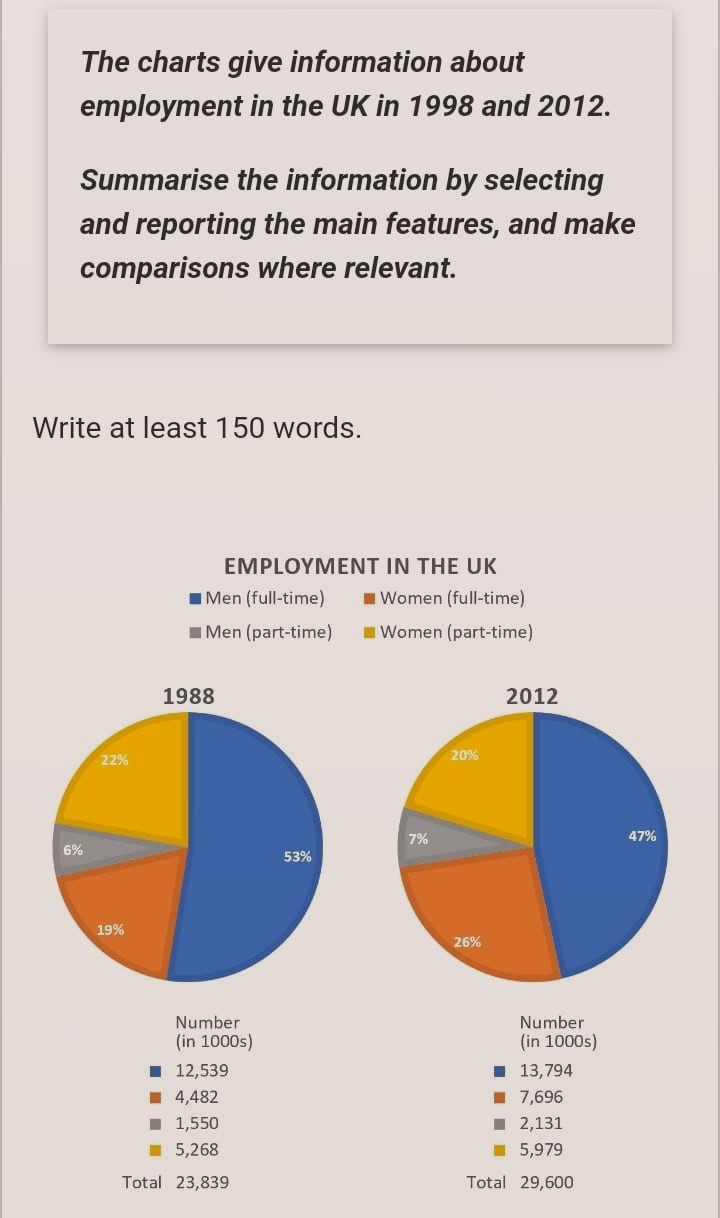
The way in which distribution of work in the employment sector differed on the basis of gender in the UK in 1988 and in 2012 is depicted in the given pie charts.
Overall, it is clear that more employment opportunities are created in the UK in the latter year, with more full-time women workers.
As per the first chart, out of the total 23,839 career opportunities in 1988, more than half went to males who did full-time jobs. This accounted for 53%, which was far more than the rate of men who worked part-time jobs (6%). However, the rate of full-time employment opportunities of men declined in 2012. Out of the total 29,600 employees in the UK, the proportion of men who fell in this category was 47%, whereas the year witnessed a per cent hike in their part-time employments.
Turning to the employment pattern of women, there was a notable increase in their full-time work participation. The growth was from 19% out of the aggregate 23,839 jobs in 1988 to 26% out of 29,600 jobs. However, the rate of those who did part-time jobs suffered a minor decline between the years, and this was by 2%.
Word count: 182