You should spend about 150 words on this task.
The charts show figures relating to hours worked and stress levels amongst professionals in eight groups.
Summarise the information by selecting and reporting the main features and make comparisons where relevant.
Write at least 150 words.
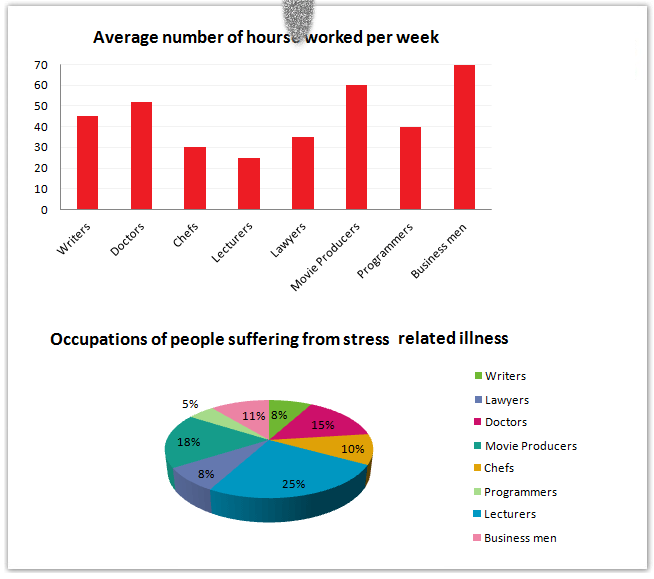
Information on the average duration of work of eight professionals in a week and the proportion of these work groups who suffered stress are depicted in the given charts.
Overall, it is clear that there is no direct relationship between duration and stress among them.
It is clear from the bar chart that businessmen work the most. In a week, the duration of their work accounts for nearly 70 hours. Movie producers and doctors are not far behind. They work around 60 and 50 hours respectively. Other professionals including writers, chefs, lecturers and programmers work within a range of 25 to 40 hours. Of these, writers work the most and lecturers work the least.
Despite being the group of professionals who work the least per week, lecturers are found to be the worst affected with stress. Exactly a quarter of them suffer from stress from the total proportion of these eight professionals. Movie producers are the next worst affected, with 18%, followed by doctors (15%). Except programmers, whose share is just 5%, the rate of the rest of the professionals who encounter stress is between 8 and 11.
Word count: 178