You should spend about 20 minutes on this task.
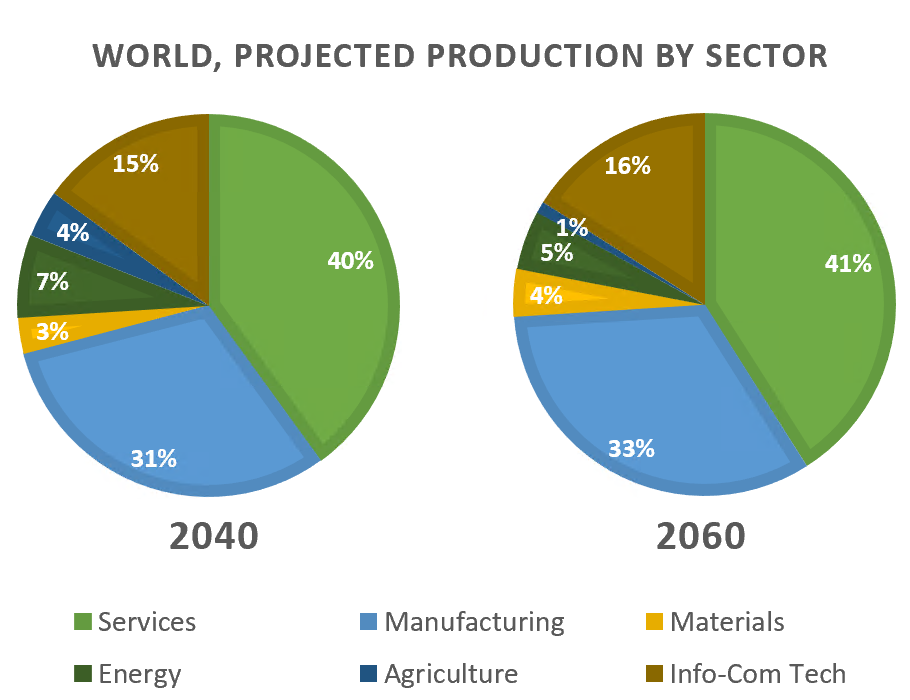
The charts show projections for global production by sector in 2040 and 2060.
Summarise the information by selecting and reporting the main features, and make comparisons where relevant.
Write at least 150 words.
An estimated world-wide production, divided by six major sectors in 2040 and 2060 is charted in the given pie diagrams.
Overall, it is clear that, except agriculture and energy sectors, other sectors would witness a slight growth between the years.
As per the first chart, the lion’s share of the global production is expected from both the service and manufacturing sectors in 2040. The rate of production from both these sectors would account for nearly three-fourth of the total production. By 2060, the former sector is anticipated to grow by a per cent from 40%, whilst the latter by 2% from 31%.Growth is also projected in both the sectors of materials and information-commerce-technology, and this is by one percentage from 15% and 3% respectively in 2060.
However, both the energy and agricultural sectors are set to see a setback between the years. When the former would loss 2% of its share in the total global production, the latter would loss 3%.
Word count: 150


