


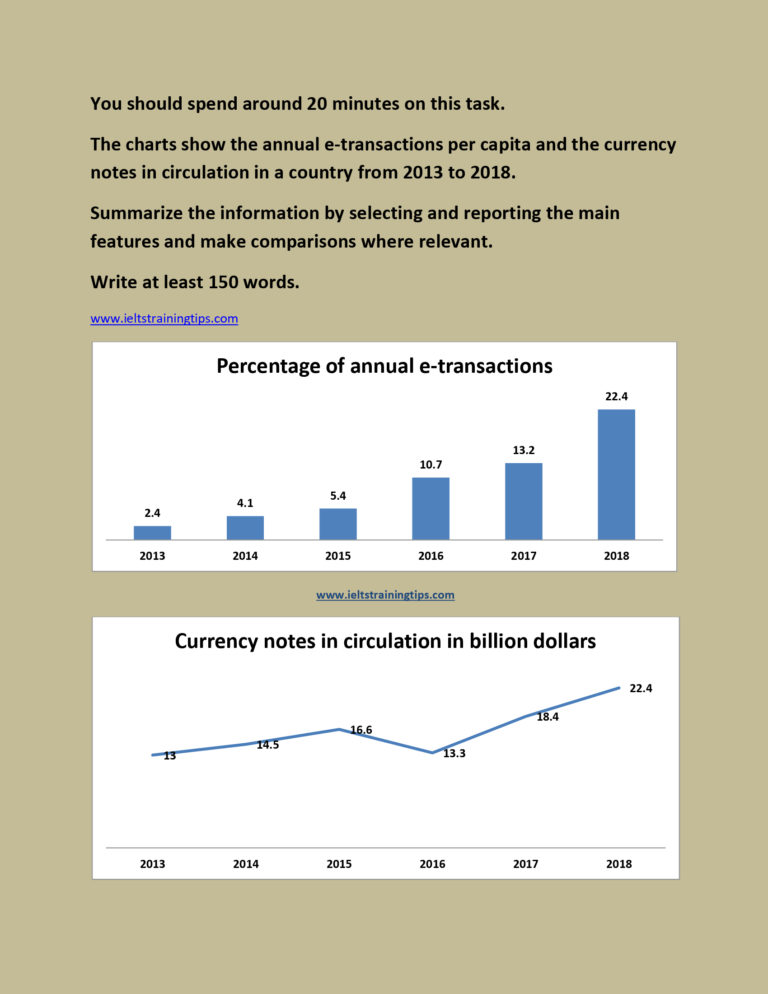
Information on the proportion of e-transactions and the circulated currency notes in a country between 2013 and 2018 is depicted in the charts.
At a glance, an upward trend is seen in both in the percentage of e-transactions as well as in the currency circulation over this period.
It is clear from the chart that the e- transaction rate recorded a ten-fold surge during this period, and this was from just 2.4 in 2013. Despite a slow growth rate from 2014 to 2015(1.3%) and from 2016 to 2017(2.5%), e-transactions saw sharp spikes throughout the period. The most significant hike was 5.3% between 2015 and 2016.
A significant leap is seen in the currency circulation too over the period from 2013 to 2018. In spite of a fall in 2016, the worth of the total currency circulated in the country ranged from $13 billion in 2013 to $22.4 billion in 2018. However, between the years 2015 and 2016, the circulation collapsed from $16.6 billion to to $13.3 billion. Then after, it went up consistently .
Word count: 150