You should spend about 20 minutes on this task.
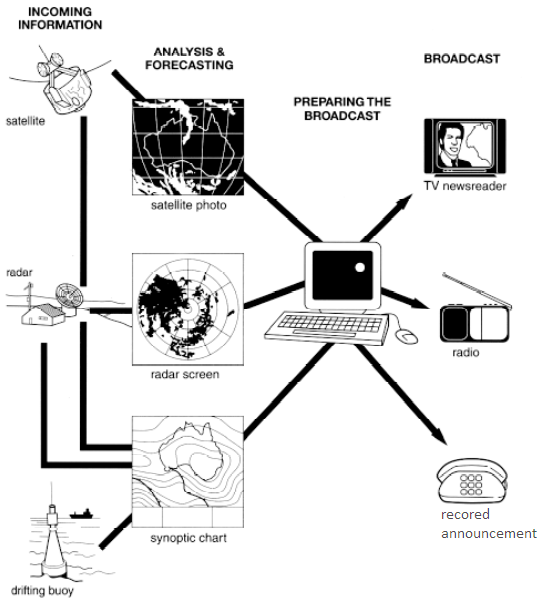
The diagram below shows how the Australian Bureau of Meteorology collects up-to-the-minute information on the weather in order to produce reliable forecasts.
Summarize the information by selecting and reporting the main features and make comparisons where relevant.
Write at least 150 words.
Various methods of collecting data regarding the weather and the ways in which up-to-date information is passed to the public by Australian Bureau of Meteorology are depicted in the given diagram.
Overall, it is clear that the information is gathered from satellites, radars and drifting buoys, and it is announced to the public via TV, radio and recorded audios.
It is clear from the charts, of these three methods, satellites take a series of pictures of the earth from the outer space and these are sent to the control unit in the earth and can be presented on a radar screen or on a synoptic chart.
From the earth, radars, which are placed at appropriate positions, read the variations in the earth’s atmosphere on their screen, and the data is sent to the meteorology department for thorough analysis. Drifting buoys, which float on the surface of the oceans too access the sea temperature and regional weather changes, and this is marked in the synoptic charts.
Every minute update from these three sources are analyzed and a nearly accurate weather forecast is prepared by the department, which is either telecasted or broadcasted. Information reaches the public via recorded announcements too.