


MODEL ANSWER>>>
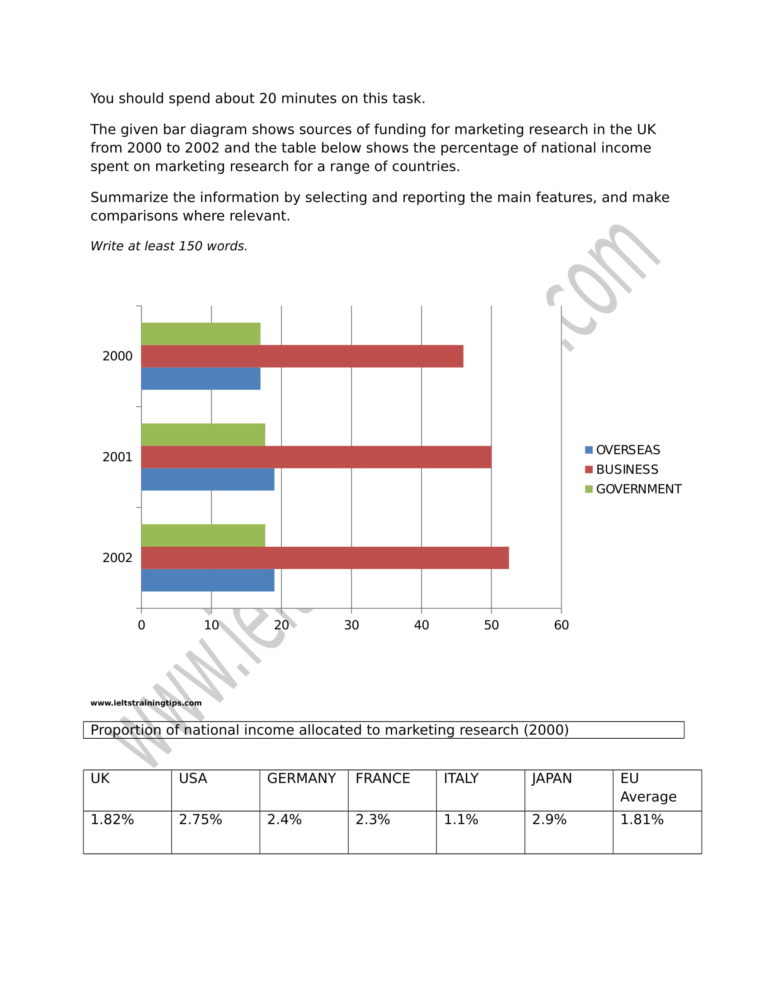
Information on the main sources of funding for marketing research in the UK from 2000 to 2002 is depicted in the bar diagram.
Overall, it is clear that the funding for marketing research in the UK had a positive trend over the given period and Japan is seen as the topmost national income contributor in the area.
As seen in the chart, between 2000 and 2002, the amount of funding allocated from each source rose slightly. Around half of all investment throughout the period came from business, whilst the government consistently contributed approximately 17 -18 %. It is noticeable that in 2000, overseas spending on marketing research in the UK was comparable to the government’s, at around 17%. However, for the next two years, it overtook the government’s.
As regards the proportion of national income allocated to marketing research in 2000, the highest percentage (2.9) was spent by Japan, followed closely by the USA (2.75). By contrast, Italy contributed the smallest amount (1.1%), significantly below the EU average of 1.81%. Even though the UK’s spending on marketing research was above the EU average in 2000, it is considerably behind France and Germany.
Word count: 177