


MODEL ANSWER>>>
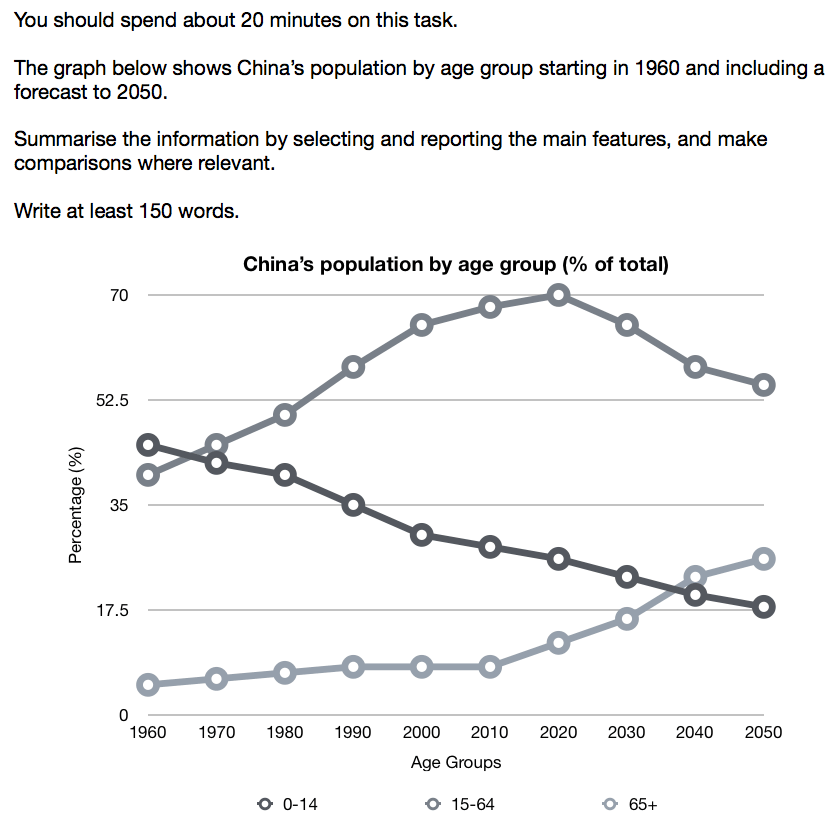
Statistical information on China’s population divided by three age groups from 1960 till now, and its projection till 2050 is illustrated in the given line graph.
Overall, a significant shift of population is seen in all three groups throughout this period, with a notable decline in case of the youngest.
As per the chart, in 1960, the most populated group was those under 15, and this accounted for over 45% of the total, which was around 5% more than those between 15 and 64. The oldest group had the least people (5%).
There occurred a steady fall in the number of young people under 15 since 1960 till now, and the rate of fall was around 25. During this time, the rate of those between 15 and 64 leapt to 70%. No notable changes were there in the volume of those over 65 till 2010, when it maintained an average of 5 to 7%.
Turning to the forecast, when the youngest population continued to dwindle to reach 17.5%, the oldest population is expected to swell to almost a quarter of the total population by 2050. It is also worthy to note an estimated drop of almost 18% in the demographic figures of the other group (15-64).
Word count: 183