The graph below shows how money was spent on different forms of entertainment over a five-year period.


The graph below shows how money was spent on different forms of entertainment over a five-year period.
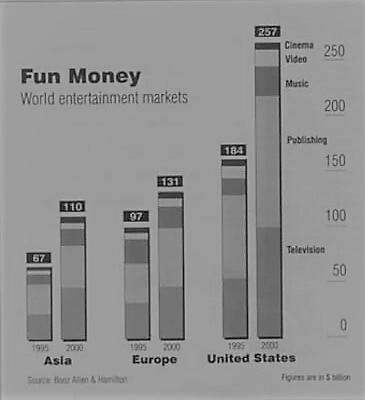
A comparison on the way which money was spent on various types of entertainment activities in the USA when compared to Europe and Asia in 1995 and 2000 is depicted in the given chart.
Overall, it is clear that the money which Americans spent on entertainment was far higher than the two regions in both the years.
As per the chart, publishing was the area where money was spent significantly in the all the three regions in both the years. In 2000, out of the total $257 billion, the expenditure of Americans on publications was nearly $120 billion, which was approximately $30 billion more than in 1995, when they spent a gross $184 billion on entertainment.
The next area of spending was on TV. In 1995, around 25 to 30 billion dollars were spent in Asia and Europe for this purpose, while in the USA; this was nearly $50 billion. The spending proportions climbed in all the regions, with USA having an exceptional growth to hit $100 billion mark.
Music, video and cinema were the areas where the spending was done comparatively less in these three regions in both years at an average of 20 to 50 billion dollars. Of this, music was the most preferred, while cinema was the least preferred.
Word count: 197