You should spend about 20 minutes on this task.
The graph below shows the average monthly use of health club in Miami and Florida by all full-time members in 2017.
Summarise the information by selecting and reporting the main features, and make comparisons where relevant.
You should write at least 150 words
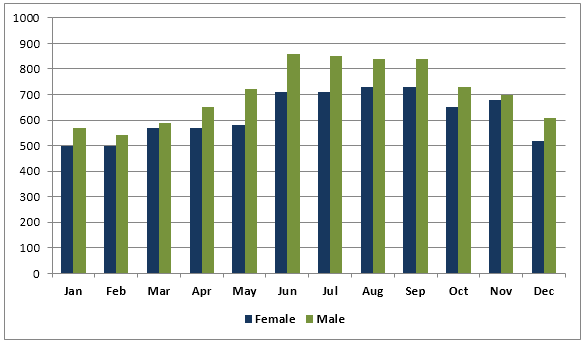
A statistical comparison of the male and female visitors to health clubs in Miami and Florida by all full-time members in 2017 is delineated in the given bar graph.
Overall, it is clear that males dominated the females in the habit of visiting the health club all through the year. It is also noted that the attendance was higher from June to September.
As per the chart, there was a growth in the number of health club visits from January to June for both genders. In case of males this was from 570 to 870 and in case of their opposite gender, it was from 500 to 700.
When the female visitors grew in number in the months of August and September to 720, the number of male visitors fell back slightly to 830 from its peak in June.
The trend was declining in the last three months of the year. In case of the male number of visitors, the decline was from around 830 in September to just over 600 in December, whereas in case of females this was from 720 to just over 500.
Word count: 175