


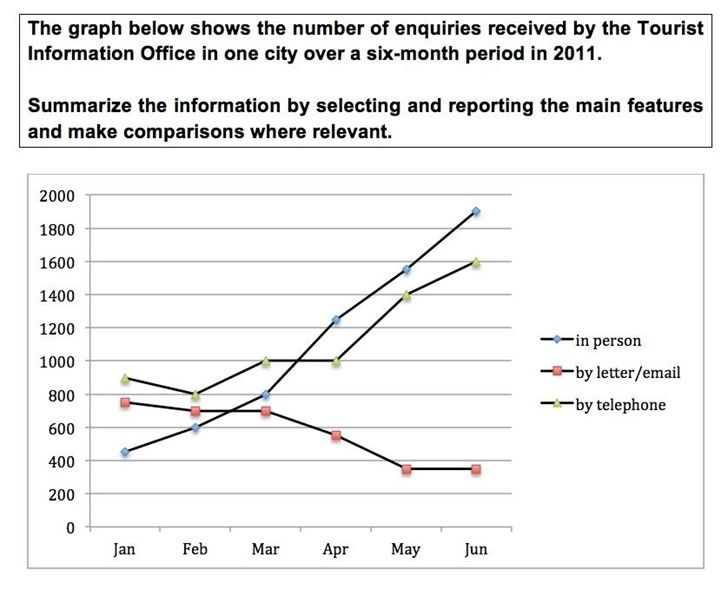
Data regarding the variations in the mode of enquiry a Tourist Information Office received in the first half of 2011 is depicted in the line graph.
Overall, it is clear that when in person and telephone enquiries went up, there was a decline in the number of enquiries via letter or email.
As seen in the chart, the number of enquiries by these three modes stood between 400 and 900 in January. Almost 800 enquiries were registered by letter or email this month, which were around 100 less than telephone enquiries.
From just over 400 in January, in person enquiries rocketed to nearly 1900 within the next five months. Except in February, the least enquires (800), and a stagnation between March and April (1000 enquires), the figures of telephone enquiries too went up to hit 1600 by June.
It is to be noted that the number of enquiries made by either letter or mail slipped by almost a half by May-June, when compared to the January’s number.
Word count: 157