


You should spend about 20 minutes on this task.
The graph below shows the percentage of adults according to age and gender who do not do any physical activity in Australia. Summarize the information by selecting and reporting the main features and make comparisons where relevant.
Write at least 150 words.
MODEL ANSWER>>>
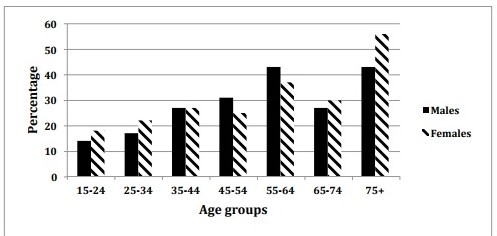
Data regarding the rate of adult population in Australia who lead a sedentary lifestyle is depicted in the given bar diagram.
Overall, it is clear that except in the age group 65- 74, the proportion of people who do no physical activity increases as the age advances.
As per the graph, the rate of idle population is seen most in the oldest age group (75+). About 57% of women follow this lifestyle from this group, while the rate of their male counterparts is almost 14% less. Other age groups in which females dominate males in this case are 15 to 34 and 65 to 74 age groups. Here, the difference between both genders ranges from 2 to 5%. When about 15% males are marked sedentary in the youngest age group, in the 65-74 age group, the proportion is seen much higher (27%).
More males from the age groups between 45 and 64 are reported to be physically inactive than females, and here the disparity is about 6%. Among these groups, almost 43% males from 55-64 group are identified as sedentary, which is the highest and same rate from the oldest group.
It is also interesting to note that the rates of both genders are exactly the same in the 35-44 group (28%).