You should spend about 20 minutes on this task.
The graph gives information about the consumption of fast food (in grams per week), in the UK from 1970 to 1990
Summarize the information by selecting and reporting the main features and make comparisons where relevant.
Write at least 150 words.
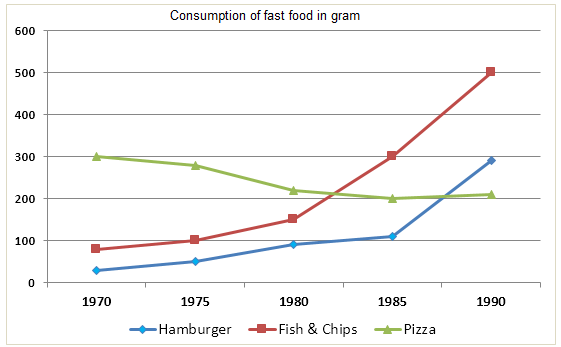
The changes in the preferences of three fast food items by the people in the UK per week between 1970 and 1990 are plotted in the given line graph.
Overall, there were significant variations in the popularity of these food items, especially during the second half of the given period.
As per the chart, the weekly consumption of pizza was far higher than the other two fast foods’ in 1970, at 300 grams. When the average weekly consumption of hamburgers was nearly 30 grams, the preference of the UK residents towards fish and chips was marked at approximately 80 grams per week.
Since 1970, the popularity of pizza started declining, and by 1985, the typical pizza consumption hit an ever-time low of 200 grams, which placed it second after fish and chips.. On the other hand, the average consumption of the other two fast foods started growing parallel till 1980 to reach around 100 and 150 grams respectively. By the end of the last decade, the hamburger consumption climbed to 300 grams a week, surpassing the pizza consumption by 1987. During this period, the typical weekly consumption of fish and chips climbed more sharply to hit 500grams.
Word count:183