You should spend about 20 minutes on this task.
The graph shows estimated oil production capacity for several Gulf countries between 1990 and 2010.
Summarise the information by selecting and reporting the main features, and make comparisons where relevant.
Write at least 150 words.
FOR VIDEO EXPLANATION: https://youtu.be/jqwYBCR63c4
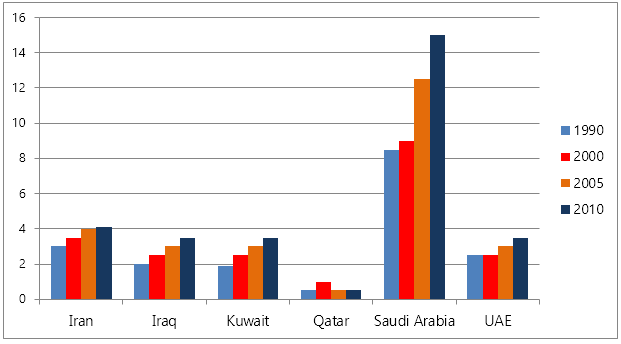
The estimated production capacity of six oil producing Gulf countries in 1990, 2000, 2005 and in 2010 is depicted in the given graph.
In general, the oil producing capacity was projected to increase in all countries except in Qatar.
As per the chart, Saudi Arabia was predicted to have the highest producing capacity in all the years. In 1990, its projected capacity was just above 8 million barrels a day, which increased substantially to 15 million in 2010. By contrast, the estimated production was the lowest in Qatar, at under a million barrel per day.
It is to be noted that the production capacity in Iran, Iraq, Kuwait and the UAE too projected an incline, but not as sharp as Saudi Arabia’s. In Iran, the production is expected to touch 4 million barrels in both 2005 and 2010. However, the rest of the countries in the list were not anticipated to cross this mark.