


You should spend about 20 minutes on this task.
The charts below show the post-school qualifications held by Canadians in the age groups 25 to 35 and 45 to 55.
Summarise the information by selecting and reporting the main features, and make comparisons where relevant.
Write at least 150 words.
MODEL ANSWER>>>
Information regarding the post-school qualifications which Canadian adults have in two specific age groups is illustrated in the given pie charts.
It is clear from the charts that more number of qualified people are there in the younger group.
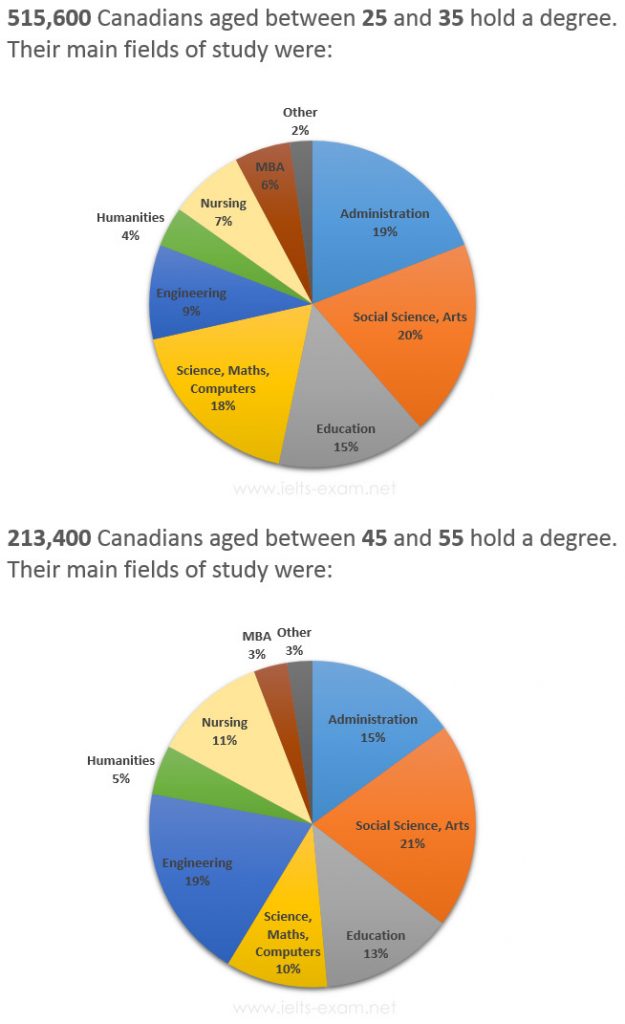
Out of the 515,600 Canadians in the age group between 25 and 35, most hold a graduation in arts or social science, and this accounts for exactly a fifth of the total. The rate of graduates from administration, science, math and computer together constitutes 37, in which administration graduates are about 19%. When around 15% possess an education degree, the proportion of Canadian youth who has an engineering, nursing degree and a post graduation in business administration varies between 6 and 9. The least rates of graduates are from humanities (4%) and other fields.
Turning to the older age group (45-55), out of the 213,400, most graduates are from the same fields compared to their younger group, however the rate is seen slightly more (by 1%). Graduates from engineering, administration and education occupy the next three respective positions: 19, 15 and 13%. Unlike the younger age group, a higher proportion of nursing graduates are seen here (11% compared to 7%), whereas the share of science, math, computer graduates is seen less (10% compared to 18%). The rate of MBA holders was just 3, which stood almost similar to humanities’ and other degrees’.